Rice Science ›› 2021, Vol. 28 ›› Issue (3): 279-288.DOI: 10.1016/j.rsci.2020.08.001
• Research Paper • Previous Articles Next Articles
Silas Akos Ibrahim1,2, Y. Rafii Mohd1,3( ), Razi Ismail Mohd1,3, Izan Ramlee Shairul3, Abd Aziz Shamsudin Noraziyah4, Ramli Asfaliza5, Chibuike Chukwu Samuel1, Swaray Senesie3, Jalloh Momodu3
Received:2020-02-10
Accepted:2020-08-06
Online:2021-05-28
Published:2021-05-28
Silas Akos Ibrahim, Y. Rafii Mohd, Razi Ismail Mohd, Izan Ramlee Shairul, Abd Aziz Shamsudin Noraziyah, Ramli Asfaliza, Chibuike Chukwu Samuel, Swaray Senesie, Jalloh Momodu. Evaluation of Inherited Resistance Genes of Bacterial Leaf Blight, Blast and Drought Tolerance in Improved Rice Lines[J]. Rice Science, 2021, 28(3): 279-288.
Add to citation manager EndNote|Ris|BibTeX
| Genotype | Blast resistance gene | BLB resistance gene | Drought tolerance QTL | ||||||||||||
|---|---|---|---|---|---|---|---|---|---|---|---|---|---|---|---|
| Pi9 | Pi2 | Piz | Xa4 | xa5 | xa13 | Xa21 | qDTY2.2 | qDTY3.2 | qDTY12.1 | ||||||
| RM6836 | RM6836 | RM6836/ RM8225 | RM224 | RM122/ RM13 | Xa13prom/ RG136 | RM21/ pTA248 | RM236 | RM520 | RM511/ RM1261 | ||||||
| Putra-1 (P)a | + | + | + | - | - | - | - | - | - | - | |||||
| IRBB60 (B)a | - | - | - | + | + | + | + | - | - | - | |||||
| MR219-PL-137 (D)a | - | - | - | - | - | - | - | + | + | + | |||||
| PD14 | + | + | + | -,, | - | - | - | + | + | + | |||||
| PD15 | + | + | + | - | - | - | - | + | + | + | |||||
| PB12 | + | + | + | + | + | + | + | - | - | - | |||||
| PB14 | + | + | + | + | + | + | + | - | - | - | |||||
| PBD1 | + | + | + | + | + | + | + | + | + | + | |||||
| PBD3 | + | + | + | + | + | + | + | + | + | + | |||||
| PDB3 | + | + | + | + | + | + | + | + | + | + | |||||
| DPB7 | + | + | + | + | + | + | + | + | + | + | |||||
| DPB12 | + | + | + | + | + | + | + | - | + | + | |||||
| DPB13 | + | + | + | + | + | + | + | + | + | + | |||||
| DPB20 | + | + | + | + | + | + | + | + | + | + | |||||
Table 1 Genotyping of 11 improved lines with resistance to blast and bacteria leaf blight (BLB) and tolerance to drought.
| Genotype | Blast resistance gene | BLB resistance gene | Drought tolerance QTL | ||||||||||||
|---|---|---|---|---|---|---|---|---|---|---|---|---|---|---|---|
| Pi9 | Pi2 | Piz | Xa4 | xa5 | xa13 | Xa21 | qDTY2.2 | qDTY3.2 | qDTY12.1 | ||||||
| RM6836 | RM6836 | RM6836/ RM8225 | RM224 | RM122/ RM13 | Xa13prom/ RG136 | RM21/ pTA248 | RM236 | RM520 | RM511/ RM1261 | ||||||
| Putra-1 (P)a | + | + | + | - | - | - | - | - | - | - | |||||
| IRBB60 (B)a | - | - | - | + | + | + | + | - | - | - | |||||
| MR219-PL-137 (D)a | - | - | - | - | - | - | - | + | + | + | |||||
| PD14 | + | + | + | -,, | - | - | - | + | + | + | |||||
| PD15 | + | + | + | - | - | - | - | + | + | + | |||||
| PB12 | + | + | + | + | + | + | + | - | - | - | |||||
| PB14 | + | + | + | + | + | + | + | - | - | - | |||||
| PBD1 | + | + | + | + | + | + | + | + | + | + | |||||
| PBD3 | + | + | + | + | + | + | + | + | + | + | |||||
| PDB3 | + | + | + | + | + | + | + | + | + | + | |||||
| DPB7 | + | + | + | + | + | + | + | + | + | + | |||||
| DPB12 | + | + | + | + | + | + | + | - | + | + | |||||
| DPB13 | + | + | + | + | + | + | + | + | + | + | |||||
| DPB20 | + | + | + | + | + | + | + | + | + | + | |||||
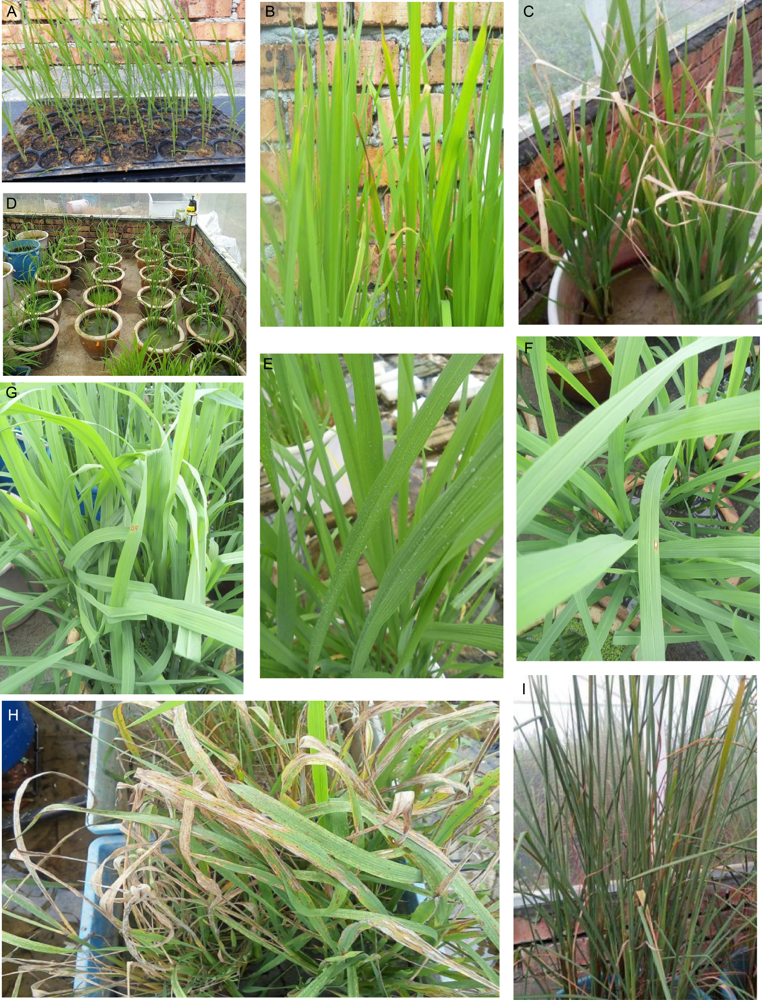
Fig. S1. Phenotyping after inoculation.A, Seedlings of improved lines for clip inoculation to Xanthomonas oryzae.B, Scored resistant (R) and moderately resistant (MR) lines.C, Susceptible to Xoo variety of rice seedlings.D, Seedlings for inoculation to Magnaporthe grisea.E, Sprayed leaves with virulent blast pathogen concentration of 1.9 × 10⁵ conidia/mL. F and G, Score of resistant (R) and moderately resistant (MR).H, Infected seedlings of susceptible variety (with no blast resistance).I, Water deficit stress at reproductive-stage drought stress on rice plants.
| Crossing method | Population code | Lines developed | Introgressed genotype |
|---|---|---|---|
| Single cross | PD | PD14, PD15 | Putra-1 × MR219-PL-137 |
| Single cross | PB | PB12, PB14 | Putra-1 × IRBB60 |
| Double cross | PDB | PDB3 | Putra-1 × MR219-PL-137 × IRBB60 |
| Three-way cross | PBD | PBD1, PBD3 | Putra-1× IRBB60 × MR219-PL-137 |
| Three-way reciprocal cross | DPB | DPB7, DPB12, DPB13, DPB20 | MR219-PL-137 × Putra-1 × IRBB60 |
Table S1. Methods of crossing for development of improved lines.
| Crossing method | Population code | Lines developed | Introgressed genotype |
|---|---|---|---|
| Single cross | PD | PD14, PD15 | Putra-1 × MR219-PL-137 |
| Single cross | PB | PB12, PB14 | Putra-1 × IRBB60 |
| Double cross | PDB | PDB3 | Putra-1 × MR219-PL-137 × IRBB60 |
| Three-way cross | PBD | PBD1, PBD3 | Putra-1× IRBB60 × MR219-PL-137 |
| Three-way reciprocal cross | DPB | DPB7, DPB12, DPB13, DPB20 | MR219-PL-137 × Putra-1 × IRBB60 |
| Genotype | DTF (d) | PH (cm) | PL (cm) | |||||||||||||||||||||||||||||||||||
|---|---|---|---|---|---|---|---|---|---|---|---|---|---|---|---|---|---|---|---|---|---|---|---|---|---|---|---|---|---|---|---|---|---|---|---|---|---|---|
| NS | RS | Pool | NS | RS | Pool | NS | RS | Pool | ||||||||||||||||||||||||||||||
| P | 89.0 ± 0.7 a | NA | NA | 103.2 ± 1.1 c | NA | NA | 25.0 ± 0.5 ab | NA | NA | |||||||||||||||||||||||||||||
| D | 88.0 ± 0.7 ab | NA | NA | 100.3 ± 1.5 c | NA | NA | 25.9 ± 0.3 ab | NA | NA | |||||||||||||||||||||||||||||
| B | 87.8 ± 0.7 a-c | 96.6 ± 0.6 a | 92.2 ± 1.5 a | 103.6 ± 1.6 c | 97.5 ± 3.7 a | 100.6 ± 2.2 b | 25.1 ± 0.1 b | 20.7 ± 0.9 c | 22.9 ± 0.9 c | |||||||||||||||||||||||||||||
| PB12 | 87.6 ± 0.4 a-c | NA | NA | 104.3 ± 2.3 c | NA | NA | 24.9 ± 0.1 b | NA | NA | |||||||||||||||||||||||||||||
| PB15 | 86.8 ± 0.7 a-d | NA | NA | 102.6 ± 1.8 c | NA | NA | 25.9 ± 0.4 ab | NA | NA | |||||||||||||||||||||||||||||
| PD14 | 85.8 ± 0.5 b-d | 91.8 ± 0.4 d | 88.8 ± 1.0 de | 102.6 ± 2.3 c | 96.7 ± 4.1 a | 99.6 ± 2.4 b | 25.3 ± 0.4 b | 23.7 ± 0.5 ab | 24.5 ± 0.4 ab | |||||||||||||||||||||||||||||
| PD15 | 87.4 ± 0.5 a-d | 92.8 ± 0.5 cd | 90.1 ± 1.0 b-d | 104.5 ± 2.8 c | 97.3 ± 4.0 a | 100.9 ± 2.6 b | 24.7 ± 0.4 b | 22.6 ± 0.5 ab | 23.6 ± 0.5 bc | |||||||||||||||||||||||||||||
| PBD1 | 87.6 ± 0.5 a-c | 94.0 ± 0.6 bc | 90.8 ± 1.1 a-c | 104.7 ± 2.4 c | 100.5 ± 3.8 a | 102.6 ± 2.3 ab | 24.9 ± 0.6 b | 22.1 ± 0.5 bc | 23.5 ± 0.6 bc | |||||||||||||||||||||||||||||
| PBD3 | 88.0 ± 0.5 ab | 94.0 ± 0.5 bc | 91.0 ± 1.0 ab | 99.9 ± 0.3 c | 96.2 ± 4.4 a | 98.1 ± 2.7 b | 22.9 ± 0.6 c | 23.3 ± 0.5 ab | 24.5 ± 0.4 ab | |||||||||||||||||||||||||||||
| PDB3 | 87.4 ± 0.5 a-d | 92.8 ± 0.4 cd | 90.1 ± 1.0 b-d | 104.1 ± 3.0 c | 100.6 ± 4.3 a | 102.3 ± 2.6 ab | 24.9 ± 0.4 b | 24.1 ± 0.4 a | 24.5 ± 0.3 ab | |||||||||||||||||||||||||||||
| DPB7 | 85.2 ± 1.7 d | 91.8 ± 0.4 d | 88.5 ± 1.4 e | 113.4 ± 2.1 a | 102.1 ± 4.3 a | 107.8 ± 2.9 a | 25.0 ± 0.5 b | 24.0 ± 1.0 a | 24.5 ± 0.5 ab | |||||||||||||||||||||||||||||
| DPB12 | 86.0 ± 1.0 b-d | 92.8 ± 0.6 cd | 89.4 ± 1.3 c-e | 106.1 ± 1.1 bc | 99.7 ± 3.5 a | 102.9 ± 2.0 ab | 25.0 ± 0.4 b | 23.4 ± 0.3 ab | 24.2 ± 0.4 ab | |||||||||||||||||||||||||||||
| DPB13 | 86.2 ± 0.9 b-d | 93.0 ± 0.7 d | 89.6 ± 1.3 b-e | 103.6 ± 2.4 c | 98.4 ± 3.7 a | 101.0 ± 2.2 b | 25.2 ± 0.4 b | 23.4 ± 0.3 ab | 24.3 ± 0.4 ab | |||||||||||||||||||||||||||||
| DPB20 | 85.6 ± 1.0 cd | 95.0 ± 0.7 b | 90.3 ± 1.7 bc | 112.3 ± 3.0 ab | 96.3 ± 4.9 a | 104.3 ± 3.8 ab | 26.6 ± 0.2 a | 23.7 ± 0.6 ab | 25.2 ± 0.6 a | |||||||||||||||||||||||||||||
| Mean | 87.03 | 93.46 | 90.08 | 104.67 | 98.54 | 102.01 | 25.09 | 23.09 | 24.02 | |||||||||||||||||||||||||||||
| CV (%) | 2.03 | 1.30 | 1.79 | 4.74 | 9.35 | 7.28 | 4.07 | 5.87 | 5.05 | |||||||||||||||||||||||||||||
| LSD | 2.25 | 1.56 | 1.43 | 6.29 | 11.82 | 6.61 | 1.30 | 1.74 | 1.08 | |||||||||||||||||||||||||||||
| h2B (%) | 66.27 | 88.09 | 75.05 | 28.63 | 20.22 | 76.52 | 31.13 | 74.83 | 4.76 | |||||||||||||||||||||||||||||
| Genotype | ET | TT | FFG | |||||||||||||||||||||||||||||||||||
| NS | RS | Pool | NS | RS | Pool | NS | RS | Pool | ||||||||||||||||||||||||||||||
| P | 10.2 ± 1.4 b-d | NA | NA | 10.6 ± 1.6 b-e | NA | NA | 172.8 ± 5.9 ab | NA | NA | |||||||||||||||||||||||||||||
| D | 13.6 ± 1.8 a | NA | NA | 13.8 ± 1.7 a | NA | NA | 168.4 ± 4.0 a-c | NA | NA | |||||||||||||||||||||||||||||
| B | 7.8 ± 1.3 de | 9.0 ± 1.6 ab | 8.4 ± 1.0 c | 8.8 ± 1.0 de | 9.6 ± 1.4 ab | 9.2 ± 0.8 b/d | 172.4 ± 9.3 ab | 26.4 ± 2.9 c | 99.4 d ± 24.8 e | |||||||||||||||||||||||||||||
| PB12 | 9.4 ± 0.5 b-e | NA | NA | 9.6 ± 0.5 c-e | NA | NA | 177.6 ± 6.6 a | NA | NA | |||||||||||||||||||||||||||||
| PB15 | 9.0 ± 1.1 c-e | NA | NA | 9.2 ± 0.9 de | NA | NA | 166.0 ± 5.8 a-d | NA | NA | |||||||||||||||||||||||||||||
| PD14 | 10.6 ± 0.4 b-d | 11.4 ± 1.2 a | 11.0 ± 0.6 a | 11.0 ± 0.5 a-d | 11.4 ± 1.2 ab | 11.2 ± 0.6 ab | 178.4 ± 8.8 a | 52.4 ± 2.3 ab | 115.4 ± 21.4 a | |||||||||||||||||||||||||||||
| PD15 | 9.6 ± 1.2 b-e | 8.0 ± 1.4 b | 8.8 ± 0.9 bc | 11.0 ± 1.1 a-d | 8.4 ± 1.2 b | 9.7 ± 0.9 b-d | 157.2 ± 1.2 cd | 49.8 ± 5.2 ab | 103.5 ± 18.1 cd | |||||||||||||||||||||||||||||
| PBD1 | 11.0 ± 1.0 a-c | 11.6 ± 0.5 a | 11.3 ± 0.5 a | 12.4 ± 1.5 a-c | 11.6 ± 0.5 a | 12.0 ± 0.8 a | 170.6 ± 3.7 a-c | 45.4 ± 2.8 b | 108.0 ± 21.0 a-c | |||||||||||||||||||||||||||||
| PBD3 | 12.0 ± 0.6 ab | 10.6 ± 1.2 ab | 11.3 ± 0.7 a | 13.2 ± 0.9 ab | 10.6 ± 1.2 ab | 11.5 ± 0.8 ab | 168.4 ± 2.7 a-c | 59.4 ± 5.9 a | 113.9 ± 18.4 ab | |||||||||||||||||||||||||||||
| PDB3 | 11.2 ± 1.1 a-c | 10.0 ± 1.3 ab | 10.6 ± 0.8 ab | 13.0 ± 1.1 ab | 10.0 ± 1.3 ab | 11.5 ± 1.0 ab | 153.4 ± 2.0 d | 48.2 ± 1.6 ab | 100.8 ± 17.6 cd | |||||||||||||||||||||||||||||
| DPB7 | 9.4 ± 0.5 b-e | 11.8 ± 0.7 a | 10.6 ± 0.6 ab | 9.8 ± 0.5 c-e | 11.8 ± 0.7 a | 10.8 ± 0.5 a-c | 161.4 ± 3.1 b-d | 53.4 ± 3.8 ab | 107.4 ± 18.2 a-d | |||||||||||||||||||||||||||||
| DPB12 | 7.2 ± 0.6 e | 9.2 ± 1.2 ab | 8.2 ± 0.7 c | 7.8 ± 0.5 e | 9.4 ± 1.0 ab | 8.6 ± 0.6 d | 152.4 ± 1.7 d | 52.2 ± 4.9 ab | 102.3 ± 16.9 cd | |||||||||||||||||||||||||||||
| DPB13 | 9.4 ± 0.5 c-e | 10.2 ± 1.2 ab | 9.8 ± 0.7 a-c | 9.6 ± 0.6 c-e | 11.4 ± 1.0 ab | 10.5 ± 0.6 a-d | 161.0 ± 3.2 b-d | 43.8 ± 5.5 b | 102.4 ± 19.8 cd | |||||||||||||||||||||||||||||
| DPB20 | 9.0 ± 1.0 c-e | 10.2 ± 1.1 ab | 9.6 ± 0.7 a-c | 9.2 ± 1.0 de | 10.4 ± 1.0 ab | 9.8 ± 0.7 b-d | 165.8 ± 3.6 a-d | 46.2 ± 4.0 b | 106.0 ± 20.1 b-d | |||||||||||||||||||||||||||||
| Mean | 9.96 | 10.20 | 9.96 | 10.64 | 10.46 | 10.52 | 166.13 | 47.72 | 105.91 | |||||||||||||||||||||||||||||
| CV (%) | 23.13 | 25.43 | 22.97 | 21.69 | 22.86 | 21.06 | 6.54 | 19.30 | 9.11 | |||||||||||||||||||||||||||||
| LSD | 2.92 | 3.33 | 2.04 | 2.93 | 3.07 | 1.97 | 13.78 | 11.81 | 8.60 | |||||||||||||||||||||||||||||
| h2B (%) | 72.11 | 52.61 | 14.31 | 76.02 | 52.09 | 7.79 | 74.06 | 81.94 | 0 | |||||||||||||||||||||||||||||
| Genotype | HGW (g) | GLWR | GD (d) | |||||||||||||||||||||||||||||||||||
| NS | RS | Pool | NS | RS | Pool | NS | RS | Pool | ||||||||||||||||||||||||||||||
| P | 2.41 ± 0.03 de | NA | NA | 4.97 ± 0.07bc | NA | NA | 117.4 ± 0.2 ab | NA | NA | |||||||||||||||||||||||||||||
| D | 2.47 ± 0.08 c-e | NA | NA | 4.98 ± 0.11 b | NA | NA | 117.4 ± 0.2 ab | NA | NA | |||||||||||||||||||||||||||||
| B | 2.35 ± 0.07 e | 2.43 ± 0.06 a | 2.39 ± 0.04 c | 5.61 ± 0.23 a | 4.42 ± 0.04 b | 5.01 ± 0.23 a | 116.8 ± 0.2 b | 133.2 ± 1.2 b | 125.0 ± 2.8 a | |||||||||||||||||||||||||||||
| PB12 | 2.55 ± 0.03 a-c | NA | NA | 4.96 ± 0.02 bc | NA | NA | 118.2 ± 0.4 a | NA | NA | |||||||||||||||||||||||||||||
| PB15 | 2.49 c-e | NA | NA | 4.81 b-d | NA | NA | 117.6 ab | NA | NA | |||||||||||||||||||||||||||||
| PD14 | 2.55 ± 0.23 a-c | 2.34 ± 0.03 a | 2.44 ± 0.04 bc | 4.86 ± 0.04 b-d | 4.49 ± 0.04 b | 4.67 ± 0.07 b | 117.4 ± 0.5 ab | 128.4 ± 0.2 b | 122.9 ± 1.9 b | |||||||||||||||||||||||||||||
| PD15 | 2.52 ± 0.02 a-d | 2.40 ± 0.05 a | 2.46 ± 0.03 a-c | 4.86 ± 0.04 b-d | 4.49 ± 0.02 b | 4.67 ± 0.06 b | 117.6 ± 0.5 ab | 127.6 ± 0.5 b | 122.6 ± 1.7 b | |||||||||||||||||||||||||||||
| PBD1 | 2.63 ± 0.04 a | 2.42 ± 0.05 a | 2.52 ± 0.05 a | 4.59 ± 0.04 b-d | 4.51 ± 0.01 b | 4.55 ± 0.03 bc | 117.6 ± 0.4 ab | 127.8 ± 0.4b | 122.7 ± 1.7 b | |||||||||||||||||||||||||||||
| PBD3 | 2.52 ± 0.04 a-d | 2.38 ± 0.05 a | 2.45 ± 0.04 a-c | 4.63 ± 0.08 b-d | 4.47 ± 0.04 b | 4.55 ± 0.05 b | 117.6 ± 0.5 ab | 129.0 ± 0.5 b | 123.3 ± 1.9 b | |||||||||||||||||||||||||||||
| PDB3 | 2.47 ± 0.04 c-e | 2.41 ± 0.03 a | 2.44 ± 0.02 bc | 4.53 ± 0.02 d | 4.50 ± 0.02 b | 4.51 ± 0.02 bc | 117.0 ± 0.6 ab | 127.8 ± 0.6 b | 122.4 ± 1.8 b | |||||||||||||||||||||||||||||
| DPB7 | 2.52 ± 0.06 a-d | 2.32 ± 0.02 a | 2.42 ± 0.05 bc | 4.51 ± 0.04 cd | 4.57 ± 0.03 ab | 4.54 ± 0.02 bc | 117.0 ± 0.7 ab | 127.4 ± 0.5 ab | 122.2 ± 1.8 b | |||||||||||||||||||||||||||||
| DPB12 | 2.52 ± 0.03 a-d | 2.35 ± 0.03 a | 2.43 ± 0.04 bc | 4.57 ± 0.04 cd | 4.75 ± 0.20 a | 4.66 ± 0.10 b | 117.6 ± 0.9 ab | 128.2 ± 0.4 a | 122.9 ± 1.8 b | |||||||||||||||||||||||||||||
| DPB13 | 2.60 ± 0.03 ab | 2.39 ± 0.03 a | 2.49 ± 0.04 ab | 4.51 ± 0.04 d | 4.57 ± 0.03 ab | 4.54 ± 0.02 bc | 117.0 ± 0.7 ab | 128.2 ± 0.6 ab | 122.6 ± 1.9 b | |||||||||||||||||||||||||||||
| DPB20 | 2.56 ± 0.03 a-c | 2.43 ± 0.02 a | 2.50 ± 0.03 ab | 4.08 ± 0.43 e | 4.53 ± 0.05 b | 4.31 ± 0.22 c | 117.8 ± 0.4 ab | 127.6 ± 0.7 b | 122.7 ± 1.7 b | |||||||||||||||||||||||||||||
| Mean | 2.51 | 2.39 | 2.45 | 4.75 | 4.53 | 4.60 | 117.43 | 128.52 | 122.93 | |||||||||||||||||||||||||||||
| CV | 3.83 | 3.75 | 3.67 | 6.63 | 3.50 | 5.99 | 0.88 | 1.09 | 1.03 | |||||||||||||||||||||||||||||
| LSD | 0.12 | 0.11 | 0.08 | 0.40 | 0.20 | 0.25 | 1.31 | 1.80 | 1.12 | |||||||||||||||||||||||||||||
| h2B (%) | 66.67 | 50.00 | 0 | 85.92 | 57.14 | 0 | 39.77 | 88.13 | 0 | |||||||||||||||||||||||||||||
Table 2 Traits of genotypes under reproductive-stage drought stress (RS), non-stress (NS) treatments and pool.
| Genotype | DTF (d) | PH (cm) | PL (cm) | |||||||||||||||||||||||||||||||||||
|---|---|---|---|---|---|---|---|---|---|---|---|---|---|---|---|---|---|---|---|---|---|---|---|---|---|---|---|---|---|---|---|---|---|---|---|---|---|---|
| NS | RS | Pool | NS | RS | Pool | NS | RS | Pool | ||||||||||||||||||||||||||||||
| P | 89.0 ± 0.7 a | NA | NA | 103.2 ± 1.1 c | NA | NA | 25.0 ± 0.5 ab | NA | NA | |||||||||||||||||||||||||||||
| D | 88.0 ± 0.7 ab | NA | NA | 100.3 ± 1.5 c | NA | NA | 25.9 ± 0.3 ab | NA | NA | |||||||||||||||||||||||||||||
| B | 87.8 ± 0.7 a-c | 96.6 ± 0.6 a | 92.2 ± 1.5 a | 103.6 ± 1.6 c | 97.5 ± 3.7 a | 100.6 ± 2.2 b | 25.1 ± 0.1 b | 20.7 ± 0.9 c | 22.9 ± 0.9 c | |||||||||||||||||||||||||||||
| PB12 | 87.6 ± 0.4 a-c | NA | NA | 104.3 ± 2.3 c | NA | NA | 24.9 ± 0.1 b | NA | NA | |||||||||||||||||||||||||||||
| PB15 | 86.8 ± 0.7 a-d | NA | NA | 102.6 ± 1.8 c | NA | NA | 25.9 ± 0.4 ab | NA | NA | |||||||||||||||||||||||||||||
| PD14 | 85.8 ± 0.5 b-d | 91.8 ± 0.4 d | 88.8 ± 1.0 de | 102.6 ± 2.3 c | 96.7 ± 4.1 a | 99.6 ± 2.4 b | 25.3 ± 0.4 b | 23.7 ± 0.5 ab | 24.5 ± 0.4 ab | |||||||||||||||||||||||||||||
| PD15 | 87.4 ± 0.5 a-d | 92.8 ± 0.5 cd | 90.1 ± 1.0 b-d | 104.5 ± 2.8 c | 97.3 ± 4.0 a | 100.9 ± 2.6 b | 24.7 ± 0.4 b | 22.6 ± 0.5 ab | 23.6 ± 0.5 bc | |||||||||||||||||||||||||||||
| PBD1 | 87.6 ± 0.5 a-c | 94.0 ± 0.6 bc | 90.8 ± 1.1 a-c | 104.7 ± 2.4 c | 100.5 ± 3.8 a | 102.6 ± 2.3 ab | 24.9 ± 0.6 b | 22.1 ± 0.5 bc | 23.5 ± 0.6 bc | |||||||||||||||||||||||||||||
| PBD3 | 88.0 ± 0.5 ab | 94.0 ± 0.5 bc | 91.0 ± 1.0 ab | 99.9 ± 0.3 c | 96.2 ± 4.4 a | 98.1 ± 2.7 b | 22.9 ± 0.6 c | 23.3 ± 0.5 ab | 24.5 ± 0.4 ab | |||||||||||||||||||||||||||||
| PDB3 | 87.4 ± 0.5 a-d | 92.8 ± 0.4 cd | 90.1 ± 1.0 b-d | 104.1 ± 3.0 c | 100.6 ± 4.3 a | 102.3 ± 2.6 ab | 24.9 ± 0.4 b | 24.1 ± 0.4 a | 24.5 ± 0.3 ab | |||||||||||||||||||||||||||||
| DPB7 | 85.2 ± 1.7 d | 91.8 ± 0.4 d | 88.5 ± 1.4 e | 113.4 ± 2.1 a | 102.1 ± 4.3 a | 107.8 ± 2.9 a | 25.0 ± 0.5 b | 24.0 ± 1.0 a | 24.5 ± 0.5 ab | |||||||||||||||||||||||||||||
| DPB12 | 86.0 ± 1.0 b-d | 92.8 ± 0.6 cd | 89.4 ± 1.3 c-e | 106.1 ± 1.1 bc | 99.7 ± 3.5 a | 102.9 ± 2.0 ab | 25.0 ± 0.4 b | 23.4 ± 0.3 ab | 24.2 ± 0.4 ab | |||||||||||||||||||||||||||||
| DPB13 | 86.2 ± 0.9 b-d | 93.0 ± 0.7 d | 89.6 ± 1.3 b-e | 103.6 ± 2.4 c | 98.4 ± 3.7 a | 101.0 ± 2.2 b | 25.2 ± 0.4 b | 23.4 ± 0.3 ab | 24.3 ± 0.4 ab | |||||||||||||||||||||||||||||
| DPB20 | 85.6 ± 1.0 cd | 95.0 ± 0.7 b | 90.3 ± 1.7 bc | 112.3 ± 3.0 ab | 96.3 ± 4.9 a | 104.3 ± 3.8 ab | 26.6 ± 0.2 a | 23.7 ± 0.6 ab | 25.2 ± 0.6 a | |||||||||||||||||||||||||||||
| Mean | 87.03 | 93.46 | 90.08 | 104.67 | 98.54 | 102.01 | 25.09 | 23.09 | 24.02 | |||||||||||||||||||||||||||||
| CV (%) | 2.03 | 1.30 | 1.79 | 4.74 | 9.35 | 7.28 | 4.07 | 5.87 | 5.05 | |||||||||||||||||||||||||||||
| LSD | 2.25 | 1.56 | 1.43 | 6.29 | 11.82 | 6.61 | 1.30 | 1.74 | 1.08 | |||||||||||||||||||||||||||||
| h2B (%) | 66.27 | 88.09 | 75.05 | 28.63 | 20.22 | 76.52 | 31.13 | 74.83 | 4.76 | |||||||||||||||||||||||||||||
| Genotype | ET | TT | FFG | |||||||||||||||||||||||||||||||||||
| NS | RS | Pool | NS | RS | Pool | NS | RS | Pool | ||||||||||||||||||||||||||||||
| P | 10.2 ± 1.4 b-d | NA | NA | 10.6 ± 1.6 b-e | NA | NA | 172.8 ± 5.9 ab | NA | NA | |||||||||||||||||||||||||||||
| D | 13.6 ± 1.8 a | NA | NA | 13.8 ± 1.7 a | NA | NA | 168.4 ± 4.0 a-c | NA | NA | |||||||||||||||||||||||||||||
| B | 7.8 ± 1.3 de | 9.0 ± 1.6 ab | 8.4 ± 1.0 c | 8.8 ± 1.0 de | 9.6 ± 1.4 ab | 9.2 ± 0.8 b/d | 172.4 ± 9.3 ab | 26.4 ± 2.9 c | 99.4 d ± 24.8 e | |||||||||||||||||||||||||||||
| PB12 | 9.4 ± 0.5 b-e | NA | NA | 9.6 ± 0.5 c-e | NA | NA | 177.6 ± 6.6 a | NA | NA | |||||||||||||||||||||||||||||
| PB15 | 9.0 ± 1.1 c-e | NA | NA | 9.2 ± 0.9 de | NA | NA | 166.0 ± 5.8 a-d | NA | NA | |||||||||||||||||||||||||||||
| PD14 | 10.6 ± 0.4 b-d | 11.4 ± 1.2 a | 11.0 ± 0.6 a | 11.0 ± 0.5 a-d | 11.4 ± 1.2 ab | 11.2 ± 0.6 ab | 178.4 ± 8.8 a | 52.4 ± 2.3 ab | 115.4 ± 21.4 a | |||||||||||||||||||||||||||||
| PD15 | 9.6 ± 1.2 b-e | 8.0 ± 1.4 b | 8.8 ± 0.9 bc | 11.0 ± 1.1 a-d | 8.4 ± 1.2 b | 9.7 ± 0.9 b-d | 157.2 ± 1.2 cd | 49.8 ± 5.2 ab | 103.5 ± 18.1 cd | |||||||||||||||||||||||||||||
| PBD1 | 11.0 ± 1.0 a-c | 11.6 ± 0.5 a | 11.3 ± 0.5 a | 12.4 ± 1.5 a-c | 11.6 ± 0.5 a | 12.0 ± 0.8 a | 170.6 ± 3.7 a-c | 45.4 ± 2.8 b | 108.0 ± 21.0 a-c | |||||||||||||||||||||||||||||
| PBD3 | 12.0 ± 0.6 ab | 10.6 ± 1.2 ab | 11.3 ± 0.7 a | 13.2 ± 0.9 ab | 10.6 ± 1.2 ab | 11.5 ± 0.8 ab | 168.4 ± 2.7 a-c | 59.4 ± 5.9 a | 113.9 ± 18.4 ab | |||||||||||||||||||||||||||||
| PDB3 | 11.2 ± 1.1 a-c | 10.0 ± 1.3 ab | 10.6 ± 0.8 ab | 13.0 ± 1.1 ab | 10.0 ± 1.3 ab | 11.5 ± 1.0 ab | 153.4 ± 2.0 d | 48.2 ± 1.6 ab | 100.8 ± 17.6 cd | |||||||||||||||||||||||||||||
| DPB7 | 9.4 ± 0.5 b-e | 11.8 ± 0.7 a | 10.6 ± 0.6 ab | 9.8 ± 0.5 c-e | 11.8 ± 0.7 a | 10.8 ± 0.5 a-c | 161.4 ± 3.1 b-d | 53.4 ± 3.8 ab | 107.4 ± 18.2 a-d | |||||||||||||||||||||||||||||
| DPB12 | 7.2 ± 0.6 e | 9.2 ± 1.2 ab | 8.2 ± 0.7 c | 7.8 ± 0.5 e | 9.4 ± 1.0 ab | 8.6 ± 0.6 d | 152.4 ± 1.7 d | 52.2 ± 4.9 ab | 102.3 ± 16.9 cd | |||||||||||||||||||||||||||||
| DPB13 | 9.4 ± 0.5 c-e | 10.2 ± 1.2 ab | 9.8 ± 0.7 a-c | 9.6 ± 0.6 c-e | 11.4 ± 1.0 ab | 10.5 ± 0.6 a-d | 161.0 ± 3.2 b-d | 43.8 ± 5.5 b | 102.4 ± 19.8 cd | |||||||||||||||||||||||||||||
| DPB20 | 9.0 ± 1.0 c-e | 10.2 ± 1.1 ab | 9.6 ± 0.7 a-c | 9.2 ± 1.0 de | 10.4 ± 1.0 ab | 9.8 ± 0.7 b-d | 165.8 ± 3.6 a-d | 46.2 ± 4.0 b | 106.0 ± 20.1 b-d | |||||||||||||||||||||||||||||
| Mean | 9.96 | 10.20 | 9.96 | 10.64 | 10.46 | 10.52 | 166.13 | 47.72 | 105.91 | |||||||||||||||||||||||||||||
| CV (%) | 23.13 | 25.43 | 22.97 | 21.69 | 22.86 | 21.06 | 6.54 | 19.30 | 9.11 | |||||||||||||||||||||||||||||
| LSD | 2.92 | 3.33 | 2.04 | 2.93 | 3.07 | 1.97 | 13.78 | 11.81 | 8.60 | |||||||||||||||||||||||||||||
| h2B (%) | 72.11 | 52.61 | 14.31 | 76.02 | 52.09 | 7.79 | 74.06 | 81.94 | 0 | |||||||||||||||||||||||||||||
| Genotype | HGW (g) | GLWR | GD (d) | |||||||||||||||||||||||||||||||||||
| NS | RS | Pool | NS | RS | Pool | NS | RS | Pool | ||||||||||||||||||||||||||||||
| P | 2.41 ± 0.03 de | NA | NA | 4.97 ± 0.07bc | NA | NA | 117.4 ± 0.2 ab | NA | NA | |||||||||||||||||||||||||||||
| D | 2.47 ± 0.08 c-e | NA | NA | 4.98 ± 0.11 b | NA | NA | 117.4 ± 0.2 ab | NA | NA | |||||||||||||||||||||||||||||
| B | 2.35 ± 0.07 e | 2.43 ± 0.06 a | 2.39 ± 0.04 c | 5.61 ± 0.23 a | 4.42 ± 0.04 b | 5.01 ± 0.23 a | 116.8 ± 0.2 b | 133.2 ± 1.2 b | 125.0 ± 2.8 a | |||||||||||||||||||||||||||||
| PB12 | 2.55 ± 0.03 a-c | NA | NA | 4.96 ± 0.02 bc | NA | NA | 118.2 ± 0.4 a | NA | NA | |||||||||||||||||||||||||||||
| PB15 | 2.49 c-e | NA | NA | 4.81 b-d | NA | NA | 117.6 ab | NA | NA | |||||||||||||||||||||||||||||
| PD14 | 2.55 ± 0.23 a-c | 2.34 ± 0.03 a | 2.44 ± 0.04 bc | 4.86 ± 0.04 b-d | 4.49 ± 0.04 b | 4.67 ± 0.07 b | 117.4 ± 0.5 ab | 128.4 ± 0.2 b | 122.9 ± 1.9 b | |||||||||||||||||||||||||||||
| PD15 | 2.52 ± 0.02 a-d | 2.40 ± 0.05 a | 2.46 ± 0.03 a-c | 4.86 ± 0.04 b-d | 4.49 ± 0.02 b | 4.67 ± 0.06 b | 117.6 ± 0.5 ab | 127.6 ± 0.5 b | 122.6 ± 1.7 b | |||||||||||||||||||||||||||||
| PBD1 | 2.63 ± 0.04 a | 2.42 ± 0.05 a | 2.52 ± 0.05 a | 4.59 ± 0.04 b-d | 4.51 ± 0.01 b | 4.55 ± 0.03 bc | 117.6 ± 0.4 ab | 127.8 ± 0.4b | 122.7 ± 1.7 b | |||||||||||||||||||||||||||||
| PBD3 | 2.52 ± 0.04 a-d | 2.38 ± 0.05 a | 2.45 ± 0.04 a-c | 4.63 ± 0.08 b-d | 4.47 ± 0.04 b | 4.55 ± 0.05 b | 117.6 ± 0.5 ab | 129.0 ± 0.5 b | 123.3 ± 1.9 b | |||||||||||||||||||||||||||||
| PDB3 | 2.47 ± 0.04 c-e | 2.41 ± 0.03 a | 2.44 ± 0.02 bc | 4.53 ± 0.02 d | 4.50 ± 0.02 b | 4.51 ± 0.02 bc | 117.0 ± 0.6 ab | 127.8 ± 0.6 b | 122.4 ± 1.8 b | |||||||||||||||||||||||||||||
| DPB7 | 2.52 ± 0.06 a-d | 2.32 ± 0.02 a | 2.42 ± 0.05 bc | 4.51 ± 0.04 cd | 4.57 ± 0.03 ab | 4.54 ± 0.02 bc | 117.0 ± 0.7 ab | 127.4 ± 0.5 ab | 122.2 ± 1.8 b | |||||||||||||||||||||||||||||
| DPB12 | 2.52 ± 0.03 a-d | 2.35 ± 0.03 a | 2.43 ± 0.04 bc | 4.57 ± 0.04 cd | 4.75 ± 0.20 a | 4.66 ± 0.10 b | 117.6 ± 0.9 ab | 128.2 ± 0.4 a | 122.9 ± 1.8 b | |||||||||||||||||||||||||||||
| DPB13 | 2.60 ± 0.03 ab | 2.39 ± 0.03 a | 2.49 ± 0.04 ab | 4.51 ± 0.04 d | 4.57 ± 0.03 ab | 4.54 ± 0.02 bc | 117.0 ± 0.7 ab | 128.2 ± 0.6 ab | 122.6 ± 1.9 b | |||||||||||||||||||||||||||||
| DPB20 | 2.56 ± 0.03 a-c | 2.43 ± 0.02 a | 2.50 ± 0.03 ab | 4.08 ± 0.43 e | 4.53 ± 0.05 b | 4.31 ± 0.22 c | 117.8 ± 0.4 ab | 127.6 ± 0.7 b | 122.7 ± 1.7 b | |||||||||||||||||||||||||||||
| Mean | 2.51 | 2.39 | 2.45 | 4.75 | 4.53 | 4.60 | 117.43 | 128.52 | 122.93 | |||||||||||||||||||||||||||||
| CV | 3.83 | 3.75 | 3.67 | 6.63 | 3.50 | 5.99 | 0.88 | 1.09 | 1.03 | |||||||||||||||||||||||||||||
| LSD | 0.12 | 0.11 | 0.08 | 0.40 | 0.20 | 0.25 | 1.31 | 1.80 | 1.12 | |||||||||||||||||||||||||||||
| h2B (%) | 66.67 | 50.00 | 0 | 85.92 | 57.14 | 0 | 39.77 | 88.13 | 0 | |||||||||||||||||||||||||||||
| Genotype | Marker | Gene/QTL | Chr. | Annealing temperature (ºC) | Repeat motif | Expected base pair size (bp) | Reference |
|---|---|---|---|---|---|---|---|
| IRBB60 | RM224 | Xa4 | 11 | 55 | (AAG)8(AG)13 | 157 | |
| RM122 | xa5 | 5 | - | (GA)7A(GA)2A(GA)11 | 227 | Wu and Tanksley,1993; Khan et al, 2015 | |
| RM153 | xa5 | 5 | 55 | (GAA)9 | 201 | ||
| RM13 | xa5 | 5 | 55 | (GA)6-(GA)16 | 141 | Khan et al, 2015 | |
| RG136 Xa13Prom | xa13 | 8 | - | - | 246 | ||
| xa13 | 8 | - | - | ||||
| RM21 | Xa-21 | 11 | 55 | (GA)18 | 157 | Chen et al, 1997; Pradhan et al, 2015 | |
| pTA248 | Xa-21 | 11 | - | - | Ronald et al, 1992 | ||
| Putra-1 | RM8225 | Piz | 6 | 55 | A11N(AAG)14 | 221 | |
| RM6836 | Piz, Pi2, Pi9 | 6 | 55 | (TCT)14 | 240 | ||
| MR219-PL-137 | RM236 | qDTY2.2 | 2 | 55 | (CT)18 | 174 | Swamy et al, 2013; |
| RM276 | qDTY2.2,3.1 | 6 | 55 | (AG)8A3(GA)33 | 149 | ||
| RM511 | qDTY12.1 | 12 | 55 | (GAC)7 | 130 | Mishra et al, 2013; Bernier et al, 2007; | |
| RM520 | qDTY3.2 | 3 | 55 | (AG)10 | 247 | ||
| RM1261 | qDTY12.1 | 12 | 50 | (AG)16 | 167 | Mishra et al, 2013; Bernier et al, 2007 |
Table S2. Polymorphic, linked and flanking markers of resistance genes and drought tolerance QTLs.
| Genotype | Marker | Gene/QTL | Chr. | Annealing temperature (ºC) | Repeat motif | Expected base pair size (bp) | Reference |
|---|---|---|---|---|---|---|---|
| IRBB60 | RM224 | Xa4 | 11 | 55 | (AAG)8(AG)13 | 157 | |
| RM122 | xa5 | 5 | - | (GA)7A(GA)2A(GA)11 | 227 | Wu and Tanksley,1993; Khan et al, 2015 | |
| RM153 | xa5 | 5 | 55 | (GAA)9 | 201 | ||
| RM13 | xa5 | 5 | 55 | (GA)6-(GA)16 | 141 | Khan et al, 2015 | |
| RG136 Xa13Prom | xa13 | 8 | - | - | 246 | ||
| xa13 | 8 | - | - | ||||
| RM21 | Xa-21 | 11 | 55 | (GA)18 | 157 | Chen et al, 1997; Pradhan et al, 2015 | |
| pTA248 | Xa-21 | 11 | - | - | Ronald et al, 1992 | ||
| Putra-1 | RM8225 | Piz | 6 | 55 | A11N(AAG)14 | 221 | |
| RM6836 | Piz, Pi2, Pi9 | 6 | 55 | (TCT)14 | 240 | ||
| MR219-PL-137 | RM236 | qDTY2.2 | 2 | 55 | (CT)18 | 174 | Swamy et al, 2013; |
| RM276 | qDTY2.2,3.1 | 6 | 55 | (AG)8A3(GA)33 | 149 | ||
| RM511 | qDTY12.1 | 12 | 55 | (GAC)7 | 130 | Mishra et al, 2013; Bernier et al, 2007; | |
| RM520 | qDTY3.2 | 3 | 55 | (AG)10 | 247 | ||
| RM1261 | qDTY12.1 | 12 | 50 | (AG)16 | 167 | Mishra et al, 2013; Bernier et al, 2007 |
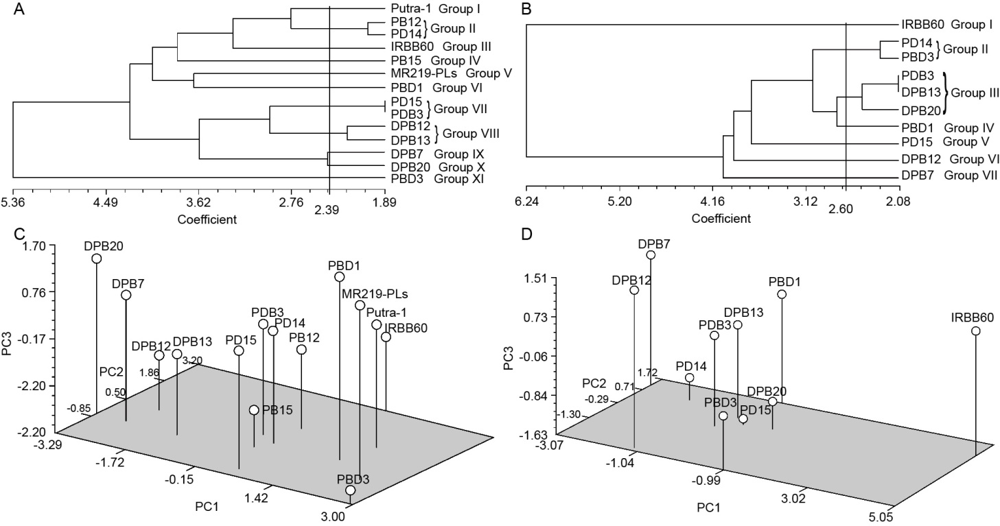
Fig. 1. Clusting analysis of 14 rice genotypes using morphological and yield traits and principal component analysis (PCA).A, Dendrogram showing relationship among 14 rice genotypes using 9 morphological and yield traits.B, Dendrogram showing relationship among 10 rice genotypes using 9 morphological and yield traits.C, Three-dimensional plot of PCA showing relationships among 14 rice genotypes using morphological and yield traits.D, Three-dimensional plot of PCA showing relationships among 10 rice genotypes using morphological and yield traits.
| Trait | Treatment | DTF | PH | PL | ET | TT | FFG | HGW | GLWR |
|---|---|---|---|---|---|---|---|---|---|
| PH | NS | -0.263* | |||||||
| RS | -0.113 | ||||||||
| Pool | -0.444** | ||||||||
| PL | NS | -0.202 | 0.306** | ||||||
| RS | -0.349* | 0.040 | |||||||
| Pool | -0.611** | 0.390** | |||||||
| ET | NS | 0.006 | -0.073 | -0.118 | |||||
| RS | -0.128 | 0.026 | 0.065 | ||||||
| Pool | 0.065 | -0.053 | -0.120 | ||||||
| TT | NS | 0.002 | -0.120 | -0.245* | 0.925** | ||||
| RS | -0.111 | 0.030 | 0.053 | 0.982** | |||||
| Pool | -0.024 | -0.041 | -0.119 | 0.927** | |||||
| FFG | NS | 0.004 | -0.136 | 0.069 | 0.082 | -0.008 | |||
| RS | -0.358* | -0.064 | 0.248 | 0.153 | 0.111 | ||||
| Pool | -0.873** | 0.391** | 0.568** | -0.068 | 0.035 | ||||
| HGW | NS | -0.277* | 0.071 | 0.069 | 0.015 | -0.037 | 0.137 | ||
| RS | 0.269 | -0.004s | -0.187 | -0.134 | -0.133 | -0.118 | |||
| Pool | -0.510** | 0.246* | 0.300** | -0.010 | 0.013 | 0.563** | |||
| GLWR | NS | 0.342** | -0.262* | -0.118 | 0.011 | 0.008 | 0.092 | -0.299 | |
| RS | -0.217 | 0.086 | 0.172 | 0.073 | 0.071 | 0.203 | -0.0004 | ||
| Pool | -0.094 | -0.027 | 0.046 | -0.032 | 0.017 | 0.204* | -0.126 | ||
| GD | NS | -0.014 | 0.138 | 0.054 | 0.112 | 0.040 | 0.233 | 0.176 | -0.126 |
| RS | 0.590** | -0.111 | -0.532** | -0.083 | -0.061 | -0.433* | 0.138 | -0.226 | |
| Pool | 0.886** | -0.412** | -0.606** | 0.097 | -0.022 | -0.951** | -0.511** | -0.227* |
Table 3 Correlation coefficients of nine traits under non-stress (NS), reproductive-stage drought stress (RS) and pool.
| Trait | Treatment | DTF | PH | PL | ET | TT | FFG | HGW | GLWR |
|---|---|---|---|---|---|---|---|---|---|
| PH | NS | -0.263* | |||||||
| RS | -0.113 | ||||||||
| Pool | -0.444** | ||||||||
| PL | NS | -0.202 | 0.306** | ||||||
| RS | -0.349* | 0.040 | |||||||
| Pool | -0.611** | 0.390** | |||||||
| ET | NS | 0.006 | -0.073 | -0.118 | |||||
| RS | -0.128 | 0.026 | 0.065 | ||||||
| Pool | 0.065 | -0.053 | -0.120 | ||||||
| TT | NS | 0.002 | -0.120 | -0.245* | 0.925** | ||||
| RS | -0.111 | 0.030 | 0.053 | 0.982** | |||||
| Pool | -0.024 | -0.041 | -0.119 | 0.927** | |||||
| FFG | NS | 0.004 | -0.136 | 0.069 | 0.082 | -0.008 | |||
| RS | -0.358* | -0.064 | 0.248 | 0.153 | 0.111 | ||||
| Pool | -0.873** | 0.391** | 0.568** | -0.068 | 0.035 | ||||
| HGW | NS | -0.277* | 0.071 | 0.069 | 0.015 | -0.037 | 0.137 | ||
| RS | 0.269 | -0.004s | -0.187 | -0.134 | -0.133 | -0.118 | |||
| Pool | -0.510** | 0.246* | 0.300** | -0.010 | 0.013 | 0.563** | |||
| GLWR | NS | 0.342** | -0.262* | -0.118 | 0.011 | 0.008 | 0.092 | -0.299 | |
| RS | -0.217 | 0.086 | 0.172 | 0.073 | 0.071 | 0.203 | -0.0004 | ||
| Pool | -0.094 | -0.027 | 0.046 | -0.032 | 0.017 | 0.204* | -0.126 | ||
| GD | NS | -0.014 | 0.138 | 0.054 | 0.112 | 0.040 | 0.233 | 0.176 | -0.126 |
| RS | 0.590** | -0.111 | -0.532** | -0.083 | -0.061 | -0.433* | 0.138 | -0.226 | |
| Pool | 0.886** | -0.412** | -0.606** | 0.097 | -0.022 | -0.951** | -0.511** | -0.227* |
| Source | DF | DTF | PH | PL | ET | ||||||||||||||
|---|---|---|---|---|---|---|---|---|---|---|---|---|---|---|---|---|---|---|---|
| NS | RS | NS | RS | NS | RS | NS | RS | NS | RS | ||||||||||
| Replication | 4 | 4 | 3.31ns | 0.93ns | 50.4ns | 74.74ns | 0.28ns | 0.62ns | 2.13ns | 8.65ns | |||||||||
| Genotype | 13 | 9 | 6.15* | 11.02** | 73.9** | 21.53ns | 3.39* | 5.47** | 13.73ns | 7.47ns | |||||||||
| Error | 52 | 36 | 3.13 | 1.49 | 24.6 | 84.94 | 1.04 | 1.84 | 5.31 | 6.73 | |||||||||
| Source | TT | FFG | 100-GW | GLW | YM | ||||||||||||||
| NS | RS | NS | RS | NS | RS | NS | RS | NS | RS | ||||||||||
| Replication | 5.32ns | 7.13ns | 239.19ns | 86.57ns | 0.02ns | 0.01ns | 0.07ns | 0.02ns | 1.68ns | 0.97ns | |||||||||
| Genotype | 16.90** | 6.22ns | 336.66* | 384.90** | 0.02** | 0.01ns | 0.61** | 0.04ns | 0.70ns | 14.63** | |||||||||
| Error | 5.33 | 5.72 | 117.92 | 84.83 | 0.01 | 0.01 | 0.10 | 0.03 | 0.01 | 1.97 | |||||||||
Table S3. ANOVA for parameters of F4 single, F3 three-way and reciprocal, and F3 (DB) crosses showing level of significance for 3 and 11 parental and progeny (improved) lines under non-stress (NS) and reproductive-stage drought stress (RS) treatment.
| Source | DF | DTF | PH | PL | ET | ||||||||||||||
|---|---|---|---|---|---|---|---|---|---|---|---|---|---|---|---|---|---|---|---|
| NS | RS | NS | RS | NS | RS | NS | RS | NS | RS | ||||||||||
| Replication | 4 | 4 | 3.31ns | 0.93ns | 50.4ns | 74.74ns | 0.28ns | 0.62ns | 2.13ns | 8.65ns | |||||||||
| Genotype | 13 | 9 | 6.15* | 11.02** | 73.9** | 21.53ns | 3.39* | 5.47** | 13.73ns | 7.47ns | |||||||||
| Error | 52 | 36 | 3.13 | 1.49 | 24.6 | 84.94 | 1.04 | 1.84 | 5.31 | 6.73 | |||||||||
| Source | TT | FFG | 100-GW | GLW | YM | ||||||||||||||
| NS | RS | NS | RS | NS | RS | NS | RS | NS | RS | ||||||||||
| Replication | 5.32ns | 7.13ns | 239.19ns | 86.57ns | 0.02ns | 0.01ns | 0.07ns | 0.02ns | 1.68ns | 0.97ns | |||||||||
| Genotype | 16.90** | 6.22ns | 336.66* | 384.90** | 0.02** | 0.01ns | 0.61** | 0.04ns | 0.70ns | 14.63** | |||||||||
| Error | 5.33 | 5.72 | 117.92 | 84.83 | 0.01 | 0.01 | 0.10 | 0.03 | 0.01 | 1.97 | |||||||||
| Source of Var. | DF | DTF (cm) | PH (cm) | PL (cm) | ET (no) | TT (no) | FFG (no) | 100GW (g) | GLW | YM (days) |
|---|---|---|---|---|---|---|---|---|---|---|
| Replications | 4 | 1.17ns | 101.74ns | 0.69ns | 7.59ns | 7.97ns | 215.44ns | 0.016ns | 0.05ns | 1.42ns |
| RS-TRT | 1 | 1142.44** | 1205.69** | 86.49** | 5.76ns | 0.36ns | 338607.61** | 0.47** | 0.51** | 3124.81** |
| G | 9 | 11.93** | 72.66ns | 5.27** | 13.92** | 13.57** | 289.05** | 0.02ns | 0.32** | 6.18** |
| RS-TRT×G | 9 | 4.48ns | 38.00ns | 4.26** | 4.98ns | 9.74* | 458.57** | 0.02* | 0.49** | 9.08** |
| Error | 76 | 2.59 | 55.15 | 1.47 | 5.23 | 4.91 | 93.16 | 0.01 | 0.08 | 1.6 |
Table S4. ANOVA for the parameters of F4 single, F3 three-way and reciprocal, and F3 double crosses generation showing interaction levels of significance.
| Source of Var. | DF | DTF (cm) | PH (cm) | PL (cm) | ET (no) | TT (no) | FFG (no) | 100GW (g) | GLW | YM (days) |
|---|---|---|---|---|---|---|---|---|---|---|
| Replications | 4 | 1.17ns | 101.74ns | 0.69ns | 7.59ns | 7.97ns | 215.44ns | 0.016ns | 0.05ns | 1.42ns |
| RS-TRT | 1 | 1142.44** | 1205.69** | 86.49** | 5.76ns | 0.36ns | 338607.61** | 0.47** | 0.51** | 3124.81** |
| G | 9 | 11.93** | 72.66ns | 5.27** | 13.92** | 13.57** | 289.05** | 0.02ns | 0.32** | 6.18** |
| RS-TRT×G | 9 | 4.48ns | 38.00ns | 4.26** | 4.98ns | 9.74* | 458.57** | 0.02* | 0.49** | 9.08** |
| Error | 76 | 2.59 | 55.15 | 1.47 | 5.23 | 4.91 | 93.16 | 0.01 | 0.08 | 1.6 |
| [1] | Akos I S, Rafii M Y, Ismail M R, Ramlee S I, Shamsudin N A A, Ramli A B, Haliru B S, Muhammad I, Chukwu S C. 2019a. A review on gene pyramiding of agronomic, biotic and abiotic traits in rice variety development. Int J Appl Biol, 3(2): 65-96. |
| [2] | Akos I S, Rafii M Y, Ismail, M R, Ramlee S I, Shamsudin N A A, Ramli A B, Jalloh M, Jamilu H, Swaray S. 2019b. Genetic inheritance of multiple traits of blast, bacteria leaf blight resistant and drought tolerant rice lines. Int J Appl Biol, 3(2): 1-35. |
| [3] | Asghar A H, Rashid M, Ashraf M, Khan M H, Chaudhry Z. 2007. Improvement of basmati rice, against fungal infection through gene transfer technology. Pak J Bot, 39(4): 1277-1283. |
| [4] | Ashkani S, Rafii M Y, Sariah M, Abdullah S N A, Rusli I, Harun A R, Latif M A. 2011. Analysis of simple sequence repeat markers linked with blast disease resistance genes in a segregating population of rice ( Oryza sativa). Genet Mol Res, 10(3): 1345-1355. |
| [5] | Atlin G N, Lafitte H R, Tao D, Laza M, Amante M, Courtois B. 2006. Developing rice cultivars for high fertility upland systems in the Asian tropics. Field Crops Res, 97: 43-52. |
| [6] | Baker J T, Allen Jr L H. 1993. Contrasting crop species responses to CO2 and temperature: Rice, soybean and citrus. Vegetation, 104: 239-260. |
| [7] | Barnabas B, Jager K, Feher A. 2008. The effect of drought and heat stress on reproductive processes in cereals. Plant Cell Environ, 31: 11-38. |
| [8] | Chang S Q, Chang T G, Song Q F, Zhu X G, Deng Q Y. 2016. Photosynthetic and agronomic traits of an elite hybrid rice Y-Liang-You 900 with a record-high yield. Field Crops Res, 187: 49-57. |
| [9] | Cruz R T, O’Toole J C, Dingkuhn M, Yambao E B, Thangaraj M, de Datta S K. 1986. Shoot and root responses to water deficit in rainfed rice. Aust J Plant Physiol, 13: 567-575. |
| [10] | Davatgar N, Weishabouri M R, Paskhah A R, Soltani A. 2009. Physiological and morphological responses of rice ( Oryza sativa L.) to varying water stress management strategies. Int J Plant Prod, 3: 19-32. |
| [11] | Falconer D S. 1989. Introduction to Quantitative Genetics. New York, USA: Longman. |
| [12] | Fitzgerald M A, McCouch S R, Hall R D. 2008. Not just a grain of rice: The quest for quality. Trends Plant Sci, 14(3): 133-139. |
| [13] | Garrity D P, O’Toole J C. 1994. Screening rice for drought resistance at the reproductive phase. Field Crops Res, 39: 99-110. |
| [14] | Geleta L F, Labuschagne M T, Viljoen C D. 2005. Genetic variability in pepper ( Capsicum annuum L.) estimated by morphological data and amplified fragment length polymorphism markers. Biodivers Conser, 14(10): 2361-2375. |
| [15] | Guerra E P, Destro D, Miranda L A, Montalvan R. 1999. Parent selection for intercrossing in food types soybean through multivariate genetic divergence. Acta Sci Agron, 21(3): 429-437. |
| [16] | Han L Z, Qiao Y L, Zhang S Y, Cao G L, Ye C R, Xu F R, Dai L Y, Ye J D, Koh H J. 2006. QTL analysis of some agronomic traits in rice under different growing environments. Agric Sci China, 5(1): 15-22. |
| [17] | He Q, Li D B, Zhu Y S, Tan M P, Zhang D P, Lin X H. 2006. Fine mapping of Xa2, a bacterial blight resistance gene in rice. Mol Breeding, 17: 1-6. |
| [18] | International Rice Research Institute (IRRI). 2014. Standard Evaluation System ( SES) for Rice. Manila, the Philippines: International rice research institute. |
| [19] | Jia Y L, McAdams S A, Bryan G T, Hershay H P, Valent B. 2000. Direct interaction of resistance gene and avirulence gene products confers rice blast resistance. Embo J, 19: 4004-4014. |
| [20] | Juraimi A S, Najib M Y M, Begum M, Anuar A R, Azmi M, Puteh A. 2009. Critical period of weed competition in direct seeded rice under saturated and flooded conditions. Pertanika J Trop Agric Sci, 32(2): 305-316. |
| [21] | Khush G S. 2005. What will it take to feed 5.0 billion rice consumers in 2030. Plant Mol Biol, 59(1): 1-6. |
| [22] | Kumar A, Dasgupta P, Kumar R. 2014. Emerging opportunities and challenges in rice production. Pop Kheti, 2(2): 6-11. |
| [23] | Lafitte H R, Price A H, Courtois B. 2004. Yield response to water deficit in an upland rice mapping population: Associations among traits and genetic markers. Theor Appl Genet, 109: 1237-1246. |
| [24] | Latif M A, Badsha M A, Tajul M I, Kabir M S, Rafii M Y, Mia M A T. 2011. Identification of genotypes resistant to blast, bacterial leaf blight, sheath blight and tungro and efficacy of seed treating fungicides against blast disease of rice. Sci Res Essays, 6(13): 2804-2811. |
| [25] | Luo Y, Tang P S, Febellar N G, TeBeest D O. 1998. Risk analysis of yield losses caused by rice leaf blast associated with temperature changes above and below for five Asian countries. Agric Ecosyst Environ, 68(3): 197-205. |
| [26] | Mashitah A B. 2018. Devlopment of weed competitive rice variety under water deficit conditions through marker assisted backcross breeding. [PhD Thesis]. Malaysia: Universiti Putra Malaysia. |
| [27] | Mazid M S, Rafii M Y, Hanafi M M, Rahim H A, Shabanimofrad M, Latif M A. 2013. Agro-morphological characterization and assessment of variability, heritability, genetic advance and divergence in bacterial blight resistant rice genotypes. S Afr J Bot, 86: 15-22. |
| [28] | Meena M L, Kumar N, Meena J K, Rai T. 2016. Genetic variability, heritability and genetic advances in chilli, Capsicum annuum. Biosci Biotechnol Res Commun, 9: 262-266. |
| [29] | Miah G, Rafii M Y, Ismail M R, Puteh A B, Rahim H A, Latif M A. 2015. Recurrent parent genome recovery analysis in a marker- assisted backcrossing program of rice (Oryza sativa L.). C R Biol, 338(2): 83-94. |
| [30] | Miah G, Rafii M Y, Ismail M R, Puteh A B, Rahim H A, Latiff M A. 2016. Marker-assisted introgression of broad-spectrum blast resistance genes into the cultivated MR219 rice variety. J Sci Food Agr, 97(9): 2810-2818. |
| [31] | Miura K, Ashikari M, Matsuoka M. 2011. The role of QTLs in the breeding of high-yielding rice. Trends Plant Sci, 16: 319-326. |
| [32] | Natraj Kumar P, Sujatha K, Laha G S, Srinivasa Rao K, Mishra B, Viraktamath B C, Hari Y, Reddy C S, Balachandran S M, Ram T, Sheshu Madhav M, Shobha Rani N, Neeraja C N, Ashok Reddy G, Shaik H, Sundaram R M. 2012. Identification and fine- mapping of Xa33, a novel gene for resistance to Xanthomonas oryzae pv. oryzae. Phytopathology, 102(2): 222-228. |
| [33] | Oladosu Y, Rafii M Y, Abdullah N, Abdul Malek A, Rahim H A, Hussin G, Abdul Latif M, Kareem I. 2014. Genetic variability and selection criteria in rice mutant lines as revealed by quantitative traits. Sci World J, 2014: 190531. |
| [34] | Rajashekara H, Ellur R K, Khanna A, Nagarajan M, Krishnan S G, Singh A K, Sharma P, Sharma T R, Singh U D. 2014. Inheritance of blast resistance and its allelic relationship with five major R genes in a rice landrace ‘Vanasurya’. Ind Phytopathol, 67(4): 365-369. |
| [35] | Ratner B. 2009. The correlation coefficient: Its values range between +1/-1, or do they? J Target Meas Anal Market, 17(2): 139-142. |
| [36] | Ribot C, Hirsch J, Balzergue S, Tharreau D, Notteghem J L, Lebrun M H, Morel J B. 2008. Susceptibility of rice to the blast fungus, Magnaporthe grisea. J Plant Physiol, 165(1): 114-124. |
| [37] | Ridzuan R, Rafii M Y, Yusoff M M, Ismail S I, Miah G, Usman M G. 2019. Genetic diversity analysis of selected Capsicum annuum genotypes based on morphophysiological, yield characteristics and their biochemical properties. J Sci Food Agr, 99: 269-280. |
| [38] | Robinson H F, Comstock R E, Harvey P H. 1949. Genotypic and phenotypic correlation in corn and their implications in selection. Agron J, 43(6): 282-287. |
| [39] | Serraj R, Kumar A, McNally K L, Slamet-Loedin I, Bruskiewich R, Mauleon R, Cairns J, Hijmans R J. 2009. Improvement of drought resistance in rice. Adv Agron, 103: 41-98. |
| [40] | Shamsudin N A A, Swamy B P M, Ratnam W, Cruz M T S, Raman A, Kumar A. 2016. Marker assisted pyramiding of drought yield QTLs into a popular Malaysian rice cultivar, MR219. BMC Genet, 17: 30. |
| [41] | Sikuku P A, Netondo G W, Musyimi D M, Onyango J C. 2010. Effects of water deficit on days to maturity and yield of three NERICA rainfed rice varieties. ARPN J Agric Biol Sci, 5(3): 1-9. |
| [42] | Singh S, Amartalingam R, Wan Harun W S, Islam M T. 1996. Simulated impact of climate change on rice production in Peninsular Malaysia. UPM: Proceeding of National Conference on Climate Change: 41-49. |
| [43] | Sukhla B. 2012. What is the importance of water for plants? Retrieved from . Accessed February 26, 2015. |
| [44] | Sundaram R M, Chatterjee S, Olivia R, Laha G S, Cruz C V, Leach J E, Sonti R V. 2014. Update on bacteria blight of rice: Fourth international conference on bacterial blight. Rice, 7: 12. |
| [45] | Taglea A G, Fujitaa D, Ebrona L A, Telebanco-Yanoriaa M J, Sasakia K, Shimarua T, Fukuta Y, Kobayashi N. 2016. Characterization of QTL for unique agronomic traits of new-plant-type rice varieties using introgression lines of IR64. Crop J, 4: 12-20. |
| [46] | Tashiro T, Wardlaw I F. 1989. A comparison of the effect of high temperature on grain development in wheat and rice. Ann Bot, 64(1): 59-65. |
| [47] | Yatung T, Dubey R K, Singh V, Upadhyay G. 2014. Genetic diversity of chilli ( Capsicum annum L.) genotypes of India based on morpho-chemical traits. Aust J Crop Sci, 8(1): 97-102. |
| [48] | Zhai W X, Zhu L H. 1999. Rice bacterial blight resistance genes and their utilization in molecular breeding. Biotechnol Progr, 19(6): 9-15. |
| [49] | Zhang G, Angeles E R, Abenes M L P, Khush G S, Huang N. 1996. RAPD and RFLP mapping of the bacterial blight resistance gene xa13 in rice. Theor Appl Genet, 93: 65-70. |
| [50] | Zhang S Y, Tan G L, Ren G M, Li M R, Li Y Y, Lan P X, Gui F R, Wang H N, Zhu S S, Li F. 2015. Investigation of rice virus diseases and analysis of the molecular variation of RSV isolates in the main rice-growing areas of Yunnan Province from 2013 to 2014. Chin J Rice Sci, 29(5): 535-545. (in Chinese with English abstract) |
| [1] | Prathap V, Suresh KUMAR, Nand Lal MEENA, Chirag MAHESHWARI, Monika DALAL, Aruna TYAGI. Phosphorus Starvation Tolerance in Rice Through a Combined Physiological, Biochemical and Proteome Analysis [J]. Rice Science, 2023, 30(6): 8-. |
| [2] | Serena REGGI, Elisabetta ONELLI, Alessandra MOSCATELLI, Nadia STROPPA, Matteo Dell’ANNO, Kiril PERFANOV, Luciana ROSSI. Seed-Specific Expression of Apolipoprotein A-IMilano Dimer in Rice Engineered Lines [J]. Rice Science, 2023, 30(6): 6-. |
| [3] | Sundus ZAFAR, XU Jianlong. Recent Advances to Enhance Nutritional Quality of Rice [J]. Rice Science, 2023, 30(6): 4-. |
| [4] | Kankunlanach KHAMPUANG, Nanthana CHAIWONG, Atilla YAZICI, Baris DEMIRER, Ismail CAKMAK, Chanakan PROM-U-THAI. Effect of Sulfur Fertilization on Productivity and Grain Zinc Yield of Rice Grown under Low and Adequate Soil Zinc Applications [J]. Rice Science, 2023, 30(6): 9-. |
| [5] | FAN Fengfeng, CAI Meng, LUO Xiong, LIU Manman, YUAN Huanran, CHENG Mingxing, Ayaz AHMAD, LI Nengwu, LI Shaoqing. Novel QTLs from Wild Rice Oryza longistaminata Confer Rice Strong Tolerance to High Temperature at Seedling Stage [J]. Rice Science, 2023, 30(6): 14-. |
| [6] | LIN Shaodan, YAO Yue, LI Jiayi, LI Xiaobin, MA Jie, WENG Haiyong, CHENG Zuxin, YE Dapeng. Application of UAV-Based Imaging and Deep Learning in Assessment of Rice Blast Resistance [J]. Rice Science, 2023, 30(6): 10-. |
| [7] | Md. Forshed DEWAN, Md. AHIDUZZAMAN, Md. Nahidul ISLAM, Habibul Bari SHOZIB. Potential Benefits of Bioactive Compounds of Traditional Rice Grown in South and South-East Asia: A Review [J]. Rice Science, 2023, 30(6): 5-. |
| [8] | Raja CHAKRABORTY, Pratap KALITA, Saikat SEN. Phenolic Profile, Antioxidant, Antihyperlipidemic and Cardiac Risk Preventive Effect of Chakhao Poireiton (A Pigmented Black Rice) in High-Fat High-Sugar induced Rats [J]. Rice Science, 2023, 30(6): 11-. |
| [9] | LI Qianlong, FENG Qi, WANG Heqin, KANG Yunhai, ZHANG Conghe, DU Ming, ZHANG Yunhu, WANG Hui, CHEN Jinjie, HAN Bin, FANG Yu, WANG Ahong. Genome-Wide Dissection of Quan 9311A Breeding Process and Application Advantages [J]. Rice Science, 2023, 30(6): 7-. |
| [10] | JI Dongling, XIAO Wenhui, SUN Zhiwei, LIU Lijun, GU Junfei, ZHANG Hao, Tom Matthew HARRISON, LIU Ke, WANG Zhiqin, WANG Weilu, YANG Jianchang. Translocation and Distribution of Carbon-Nitrogen in Relation to Rice Yield and Grain Quality as Affected by High Temperature at Early Panicle Initiation Stage [J]. Rice Science, 2023, 30(6): 12-. |
| [11] | Nazaratul Ashifa Abdullah Salim, Norlida Mat Daud, Julieta Griboff, Abdul Rahim Harun. Elemental Assessments in Paddy Soil for Geographical Traceability of Rice from Peninsular Malaysia [J]. Rice Science, 2023, 30(5): 486-498. |
| [12] | Tan Jingyi, Zhang Xiaobo, Shang Huihui, Li Panpan, Wang Zhonghao, Liao Xinwei, Xu Xia, Yang Shihua, Gong Junyi, Wu Jianli. ORYZA SATIVA SPOTTED-LEAF 41 (OsSPL41) Negatively Regulates Plant Immunity in Rice [J]. Rice Science, 2023, 30(5): 426-436. |
| [13] | Monica Ruffini Castiglione, Stefania Bottega, Carlo Sorce, Carmelina SpanÒ. Effects of Zinc Oxide Particles with Different Sizes on Root Development in Oryza sativa [J]. Rice Science, 2023, 30(5): 449-458. |
| [14] | Ammara Latif, Sun Ying, Pu Cuixia, Noman Ali. Rice Curled Its Leaves Either Adaxially or Abaxially to Combat Drought Stress [J]. Rice Science, 2023, 30(5): 405-416. |
| [15] | Liu Qiao, Qiu Linlin, Hua Yangguang, Li Jing, Pang Bo, Zhai Yufeng, Wang Dekai. LHD3 Encoding a J-Domain Protein Controls Heading Date in Rice [J]. Rice Science, 2023, 30(5): 437-448. |
| Viewed | ||||||
|
Full text |
|
|||||
|
Abstract |
|
|||||