Rice Science ›› 2020, Vol. 27 ›› Issue (6): 515-528.DOI: 10.1016/j.rsci.2020.09.008
• Research Paper • Previous Articles Next Articles
Mondal Satyen1,2,3( ), Jamil Hasan M.2, Ahmed Tofayel4, Giashuddin Miah M.4, C. Sta Cruz Pompe3, M. Ismail Abdel1()
Received:2019-08-13
Accepted:2019-12-09
Online:2020-11-28
Published:2020-11-28
Mondal Satyen, Jamil Hasan M., Ahmed Tofayel, Giashuddin Miah M., C. Sta Cruz Pompe, M. Ismail Abdel. Effects of AG1 and AG2 QTLs on Nonstructural Carbohydrate and Seed Management Options for Rice Seedling Growth and Establishment under Flooding Stress[J]. Rice Science, 2020, 27(6): 515-528.
Add to citation manager EndNote|Ris|BibTeX
| Carbohydrate | Genotype | Flooded | Control | |||||||||
|---|---|---|---|---|---|---|---|---|---|---|---|---|
| 0 DAS | 1 DAS | 2 DAS | 3 DAS | 7 DAS | 0 DAS | 1 DAS | 2 DAS | 3 DAS | 7 DAS | |||
| Soluble sugar | PSB Rc82-AG1 | 1.1 | 1.1 | 1.1 | 1.6 | 2.0 | 1.1 | 1.5 | 1.8 | 2.3 | 3.1 | |
| PSB Rc82-AG2 | 1.1 | 1.1 | 1.1 | 1.7 | 2.1 | 1.1 | 1.5 | 1.8 | 2.3 | 3.2 | ||
| PSB Rc82-AG1-AG2 | 1.1 | 1.2 | 1.3 | 1.9 | 2.3 | 1.1 | 1.5 | 1.8 | 2.3 | 3.2 | ||
| Ciherang-Sub1-AG1 | 1.1 | 1.1 | 1.1 | 1.6 | 2.1 | 1.1 | 1.5 | 1.9 | 2.3 | 3.3 | ||
| Ciherang-Sub1-AG2 | 1.1 | 1.2 | 1.1 | 1.8 | 2.4 | 1.1 | 1.5 | 1.9 | 2.3 | 3.3 | ||
| Ciherang-Sub1-AG1-AG2 | 1.1 | 1.2 | 1.2 | 1.9 | 2.5 | 1.1 | 1.6 | 2.0 | 2.4 | 3.3 | ||
| PSB Rc82 | 0.9 | 0.9 | 0.9 | 0.9 | 1.0 | 0.9 | 1.7 | 1.9 | 2.6 | 3.2 | ||
| Ciherang-Sub1 | 1.0 | 1.0 | 1.0 | 1.0 | 1.4 | 1.0 | 1.6 | 2.0 | 2.5 | 3.3 | ||
| Kho Hlan On | 1.2 | 1.2 | 1.2 | 2.1 | 3.0 | 1.2 | 1.6 | 2.0 | 2.5 | 3.3 | ||
| Ma-Zhan Red | 1.2 | 1.2 | 1.2 | 1.9 | 2.7 | 1.2 | 1.5 | 2.0 | 2.5 | 3.3 | ||
| Mean | 1.1 | 1.1 | 1.1 | 1.6 | 2.2 | 1.1 | 1.6 | 1.9 | 2.4 | 3.3 | ||
| HSD0.05 | ns | 0.20*** | 0.19*** | 0.31*** | 0.37*** | ns | ns | ns | 0.31*** | ns | ||
| Starch | PSB Rc82-AG1 | 74.5 | 72.8 | 69.9 | 66.9 | 64.0 | 74.5 | 69.1 | 63.1 | 56.1 | 24.5 | |
| PSB Rc82-AG2 | 77.6 | 74.2 | 66.8 | 64.0 | 61.1 | 77.6 | 71.4 | 62.9 | 56.4 | 23.4 | ||
| PSB Rc82-AG1-AG2 | 75.8 | 72.9 | 70.3 | 66.5 | 60.2 | 75.8 | 69.9 | 64.6 | 54.7 | 22.4 | ||
| Ciherang-Sub1-AG1 | 75.3 | 72.9 | 69.4 | 66.6 | 62.0 | 75.3 | 72.3 | 65.6 | 57.8 | 25.3 | ||
| Ciherang-Sub1-AG2 | 77.5 | 75.0 | 71.2 | 66.0 | 60.6 | 77.5 | 69.6 | 63.7 | 55.4 | 16.5 | ||
| Ciherang-Sub1-AG1-AG2 | 76.7 | 73.8 | 69.1 | 65.7 | 59.8 | 76.7 | 71.3 | 63.9 | 58.0 | 17.8 | ||
| PSB Rc82 | 75.8 | 74.5 | 74.0 | 72.1 | 68.1 | 75.8 | 70.3 | 63.0 | 57.0 | 27.1 | ||
| Ciherang-Sub1 | 74.5 | 72.9 | 72.3 | 69.6 | 65.8 | 74.5 | 72.0 | 66.1 | 56.4 | 20.7 | ||
| Kho Hlan On | 78.9 | 73.2 | 70.2 | 65.4 | 59.0 | 78.9 | 72.6 | 66.5 | 55.5 | 17.1 | ||
| Ma-Zhan Red | 76.1 | 71.3 | 70.5 | 65.5 | 60.0 | 76.1 | 68.8 | 63.0 | 58.0 | 15.2 | ||
| Mean | 76.3 | 73.4 | 70.4 | 66.8 | 62.1 | 76.3 | 70.7 | 64.2 | 56.5 | 21.0 | ||
| HSD0.05 | ns | ns | ns | ns | 5.23*** | ns | ns | ns | ns | ns | ||
Table 1 Soluble sugar and starch concentrations in germinating seeds under flooded with 10 cm water depth and control conditions in greenhouse. %
| Carbohydrate | Genotype | Flooded | Control | |||||||||
|---|---|---|---|---|---|---|---|---|---|---|---|---|
| 0 DAS | 1 DAS | 2 DAS | 3 DAS | 7 DAS | 0 DAS | 1 DAS | 2 DAS | 3 DAS | 7 DAS | |||
| Soluble sugar | PSB Rc82-AG1 | 1.1 | 1.1 | 1.1 | 1.6 | 2.0 | 1.1 | 1.5 | 1.8 | 2.3 | 3.1 | |
| PSB Rc82-AG2 | 1.1 | 1.1 | 1.1 | 1.7 | 2.1 | 1.1 | 1.5 | 1.8 | 2.3 | 3.2 | ||
| PSB Rc82-AG1-AG2 | 1.1 | 1.2 | 1.3 | 1.9 | 2.3 | 1.1 | 1.5 | 1.8 | 2.3 | 3.2 | ||
| Ciherang-Sub1-AG1 | 1.1 | 1.1 | 1.1 | 1.6 | 2.1 | 1.1 | 1.5 | 1.9 | 2.3 | 3.3 | ||
| Ciherang-Sub1-AG2 | 1.1 | 1.2 | 1.1 | 1.8 | 2.4 | 1.1 | 1.5 | 1.9 | 2.3 | 3.3 | ||
| Ciherang-Sub1-AG1-AG2 | 1.1 | 1.2 | 1.2 | 1.9 | 2.5 | 1.1 | 1.6 | 2.0 | 2.4 | 3.3 | ||
| PSB Rc82 | 0.9 | 0.9 | 0.9 | 0.9 | 1.0 | 0.9 | 1.7 | 1.9 | 2.6 | 3.2 | ||
| Ciherang-Sub1 | 1.0 | 1.0 | 1.0 | 1.0 | 1.4 | 1.0 | 1.6 | 2.0 | 2.5 | 3.3 | ||
| Kho Hlan On | 1.2 | 1.2 | 1.2 | 2.1 | 3.0 | 1.2 | 1.6 | 2.0 | 2.5 | 3.3 | ||
| Ma-Zhan Red | 1.2 | 1.2 | 1.2 | 1.9 | 2.7 | 1.2 | 1.5 | 2.0 | 2.5 | 3.3 | ||
| Mean | 1.1 | 1.1 | 1.1 | 1.6 | 2.2 | 1.1 | 1.6 | 1.9 | 2.4 | 3.3 | ||
| HSD0.05 | ns | 0.20*** | 0.19*** | 0.31*** | 0.37*** | ns | ns | ns | 0.31*** | ns | ||
| Starch | PSB Rc82-AG1 | 74.5 | 72.8 | 69.9 | 66.9 | 64.0 | 74.5 | 69.1 | 63.1 | 56.1 | 24.5 | |
| PSB Rc82-AG2 | 77.6 | 74.2 | 66.8 | 64.0 | 61.1 | 77.6 | 71.4 | 62.9 | 56.4 | 23.4 | ||
| PSB Rc82-AG1-AG2 | 75.8 | 72.9 | 70.3 | 66.5 | 60.2 | 75.8 | 69.9 | 64.6 | 54.7 | 22.4 | ||
| Ciherang-Sub1-AG1 | 75.3 | 72.9 | 69.4 | 66.6 | 62.0 | 75.3 | 72.3 | 65.6 | 57.8 | 25.3 | ||
| Ciherang-Sub1-AG2 | 77.5 | 75.0 | 71.2 | 66.0 | 60.6 | 77.5 | 69.6 | 63.7 | 55.4 | 16.5 | ||
| Ciherang-Sub1-AG1-AG2 | 76.7 | 73.8 | 69.1 | 65.7 | 59.8 | 76.7 | 71.3 | 63.9 | 58.0 | 17.8 | ||
| PSB Rc82 | 75.8 | 74.5 | 74.0 | 72.1 | 68.1 | 75.8 | 70.3 | 63.0 | 57.0 | 27.1 | ||
| Ciherang-Sub1 | 74.5 | 72.9 | 72.3 | 69.6 | 65.8 | 74.5 | 72.0 | 66.1 | 56.4 | 20.7 | ||
| Kho Hlan On | 78.9 | 73.2 | 70.2 | 65.4 | 59.0 | 78.9 | 72.6 | 66.5 | 55.5 | 17.1 | ||
| Ma-Zhan Red | 76.1 | 71.3 | 70.5 | 65.5 | 60.0 | 76.1 | 68.8 | 63.0 | 58.0 | 15.2 | ||
| Mean | 76.3 | 73.4 | 70.4 | 66.8 | 62.1 | 76.3 | 70.7 | 64.2 | 56.5 | 21.0 | ||
| HSD0.05 | ns | ns | ns | ns | 5.23*** | ns | ns | ns | ns | ns | ||
| Genotype | Soluble sugar concentration (%) | Starch concentration (%) | |||||||||||||
|---|---|---|---|---|---|---|---|---|---|---|---|---|---|---|---|
| Flooded | Control | Flooded | Control | ||||||||||||
| 28 DAS | PI | MS | 28 DAS | PI | MS | 28 DAS | PI | MS | 28 DAS | PI | MS | ||||
| Wet season in 2016 | |||||||||||||||
| Ciherang-Sub1-AG1 | 2.6 | 5.4 | 6.3 | 3.9 | 6.0 | 5.7 | 3.5 | 5.5 | 3.5 | 3.8 | 6.1 | 3.0 | |||
| Ciherang-Sub1-AG2 | 2.9 | 8.1 | 5.5 | 3.9 | 7.9 | 5.0 | 3.9 | 7.4 | 3.4 | 4.1 | 6.9 | 1.8 | |||
| Ciherang-Sub1-AG1-AG2 | 2.5 | 9.1 | 7.1 | 5.5 | 8.4 | 5.4 | 3.5 | 6.8 | 2.9 | 4.2 | 6.6 | 2.7 | |||
| Ciherang-Sub1 | 1.9 | 5.7 | 5.0 | 4.4 | 6.3 | 4.4 | 3.7 | 4.4 | 2.9 | 3.8 | 5.8 | 2.2 | |||
| Kho Hlan On | 3.9 | 9.8 | 4.8 | 4.3 | 9.9 | 4.4 | 3.8 | 6.1 | 2.9 | 3.6 | 6.7 | 3.8 | |||
| Ma-Zhan Red | 4.0 | 8.5 | 4.7 | 3.8 | 8.5 | 4.7 | 3.6 | 6.0 | 3.0 | 2.9 | 6.7 | 2.7 | |||
| Mean | 3.0 | 7.8 | 5.6 | 4.3 | 7.8 | 4.9 | 3.7 | 6.0 | 3.1 | 3.7 | 6.5 | 2.7 | |||
| HSD0.05 | 0.97*** | ns | ns | 0.97*** | ns | ns | 0.92* | 0.84*** | ns | 0.92* | 0.84*** | ns | |||
| Dry season in 2017 | |||||||||||||||
| PSB Rc82-AG1 | 3.3 | 5.4 | 4.5 | 3.5 | 4.8 | 3.1 | 3.6 | 3.5 | 0.9 | 4.7 | 6.4 | 2.8 | |||
| PSB Rc82-AG2 | 4.0 | 5.0 | 3.8 | 2.6 | 4.2 | 3.8 | 3.8 | 3.9 | 1.3 | 5.9 | 7.2 | 2.1 | |||
| PSB Rc82-AG1-AG2 | 3.0 | 5.2 | 2.3 | 2.8 | 4.3 | 4.0 | 4.2 | 4.8 | 1.2 | 4.6 | 5.5 | 4.0 | |||
| Ciherang-Sub1-AG1 | 4.0 | 5.6 | 4.8 | 4.1 | 5.3 | 4.0 | 4.4 | 3.8 | 1.2 | 4.7 | 5.3 | 1.2 | |||
| Ciherang-Sub1-G2 | 4.7 | 7.0 | 4.9 | 4.5 | 7.2 | 5.6 | 4.7 | 6.4 | 1.6 | 4.1 | 5.4 | 2.4 | |||
| Ciherang-Sub1-AG1-AG2 | 5.4 | 5.4 | 3.3 | 4.2 | 5.8 | 4.0 | 4.1 | 5.7 | 1.5 | 5.1 | 5.2 | 1.9 | |||
| PSB Rc82 | 3.4 | 6.3 | 2.8 | 3.1 | 4.9 | 3.9 | 3.7 | 6.6 | 1.1 | 4.2 | 5.9 | 1.4 | |||
| Ciherang-Sub1 | 4.3 | 7.5 | 2.3 | 4.6 | 5.0 | 3.5 | 4.8 | 5.1 | 1.9 | 4.1 | 4.7 | 2.1 | |||
| Kho Hlan On | 4.6 | 8.8 | 4.3 | 6.0 | 8.4 | 5.6 | 7.4 | 8.5 | 2.6 | 4.0 | 7.4 | 3.4 | |||
| Ma-Zhan Red | 3.6 | 8.0 | 4.8 | 4.6 | 5.7 | 2.6 | 4.7 | 5.9 | 1.6 | 4.1 | 4.4 | 1.9 | |||
| Mean | 4.0 | 6.4 | 3.8 | 4.0 | 5.6 | 4.0 | 4.5 | 5.4 | 1.5 | 4.5 | 5.7 | 2.3 | |||
| HSD0.05 | ns | ns | 1.71*** | ns | ns | 1.71*** | 1.08*** | 1.76*** | 0.79*** | 1.08*** | 1.76*** | 0.79*** | |||
Table 2 Sugar and starch concentrations in rice stem at different growth stages under flooded with 3-5 cm water depth and control conditions in field. %
| Genotype | Soluble sugar concentration (%) | Starch concentration (%) | |||||||||||||
|---|---|---|---|---|---|---|---|---|---|---|---|---|---|---|---|
| Flooded | Control | Flooded | Control | ||||||||||||
| 28 DAS | PI | MS | 28 DAS | PI | MS | 28 DAS | PI | MS | 28 DAS | PI | MS | ||||
| Wet season in 2016 | |||||||||||||||
| Ciherang-Sub1-AG1 | 2.6 | 5.4 | 6.3 | 3.9 | 6.0 | 5.7 | 3.5 | 5.5 | 3.5 | 3.8 | 6.1 | 3.0 | |||
| Ciherang-Sub1-AG2 | 2.9 | 8.1 | 5.5 | 3.9 | 7.9 | 5.0 | 3.9 | 7.4 | 3.4 | 4.1 | 6.9 | 1.8 | |||
| Ciherang-Sub1-AG1-AG2 | 2.5 | 9.1 | 7.1 | 5.5 | 8.4 | 5.4 | 3.5 | 6.8 | 2.9 | 4.2 | 6.6 | 2.7 | |||
| Ciherang-Sub1 | 1.9 | 5.7 | 5.0 | 4.4 | 6.3 | 4.4 | 3.7 | 4.4 | 2.9 | 3.8 | 5.8 | 2.2 | |||
| Kho Hlan On | 3.9 | 9.8 | 4.8 | 4.3 | 9.9 | 4.4 | 3.8 | 6.1 | 2.9 | 3.6 | 6.7 | 3.8 | |||
| Ma-Zhan Red | 4.0 | 8.5 | 4.7 | 3.8 | 8.5 | 4.7 | 3.6 | 6.0 | 3.0 | 2.9 | 6.7 | 2.7 | |||
| Mean | 3.0 | 7.8 | 5.6 | 4.3 | 7.8 | 4.9 | 3.7 | 6.0 | 3.1 | 3.7 | 6.5 | 2.7 | |||
| HSD0.05 | 0.97*** | ns | ns | 0.97*** | ns | ns | 0.92* | 0.84*** | ns | 0.92* | 0.84*** | ns | |||
| Dry season in 2017 | |||||||||||||||
| PSB Rc82-AG1 | 3.3 | 5.4 | 4.5 | 3.5 | 4.8 | 3.1 | 3.6 | 3.5 | 0.9 | 4.7 | 6.4 | 2.8 | |||
| PSB Rc82-AG2 | 4.0 | 5.0 | 3.8 | 2.6 | 4.2 | 3.8 | 3.8 | 3.9 | 1.3 | 5.9 | 7.2 | 2.1 | |||
| PSB Rc82-AG1-AG2 | 3.0 | 5.2 | 2.3 | 2.8 | 4.3 | 4.0 | 4.2 | 4.8 | 1.2 | 4.6 | 5.5 | 4.0 | |||
| Ciherang-Sub1-AG1 | 4.0 | 5.6 | 4.8 | 4.1 | 5.3 | 4.0 | 4.4 | 3.8 | 1.2 | 4.7 | 5.3 | 1.2 | |||
| Ciherang-Sub1-G2 | 4.7 | 7.0 | 4.9 | 4.5 | 7.2 | 5.6 | 4.7 | 6.4 | 1.6 | 4.1 | 5.4 | 2.4 | |||
| Ciherang-Sub1-AG1-AG2 | 5.4 | 5.4 | 3.3 | 4.2 | 5.8 | 4.0 | 4.1 | 5.7 | 1.5 | 5.1 | 5.2 | 1.9 | |||
| PSB Rc82 | 3.4 | 6.3 | 2.8 | 3.1 | 4.9 | 3.9 | 3.7 | 6.6 | 1.1 | 4.2 | 5.9 | 1.4 | |||
| Ciherang-Sub1 | 4.3 | 7.5 | 2.3 | 4.6 | 5.0 | 3.5 | 4.8 | 5.1 | 1.9 | 4.1 | 4.7 | 2.1 | |||
| Kho Hlan On | 4.6 | 8.8 | 4.3 | 6.0 | 8.4 | 5.6 | 7.4 | 8.5 | 2.6 | 4.0 | 7.4 | 3.4 | |||
| Ma-Zhan Red | 3.6 | 8.0 | 4.8 | 4.6 | 5.7 | 2.6 | 4.7 | 5.9 | 1.6 | 4.1 | 4.4 | 1.9 | |||
| Mean | 4.0 | 6.4 | 3.8 | 4.0 | 5.6 | 4.0 | 4.5 | 5.4 | 1.5 | 4.5 | 5.7 | 2.3 | |||
| HSD0.05 | ns | ns | 1.71*** | ns | ns | 1.71*** | 1.08*** | 1.76*** | 0.79*** | 1.08*** | 1.76*** | 0.79*** | |||

Fig. 1. Relationship of stem nonstructural carbohydrates (NSCs) with plant height at different growth stages under flooded condition.
| Genotypes | Amylose content (%) | Sugar content (%) | Starch content (%) |
|---|---|---|---|
| PSB Rc82-AG1 | 20.3±0.5 | 1.78±0.2 | 56.6±0.5 |
| PSB Rc82-AG2 | 20.8±1.4 | 2.04±0.1 | 58.4±0.6 |
| PSB Rc82-AG1-AG2 | 22.7±0.9 | 2.12±0.0 | 55.7±0.6 |
| Ciherang-Sub1-AG1 | 21.1±0.2 | 1.31±0.1 | 59.4±0.8 |
| Ciherang-Sub1-AG2 | 21.4±0.5 | 1.6±0.1 | 63.7±4.3 |
| Ciherang-Sub1-AG1-AG2 | 20.9±0.4 | 1.23±0.1 | 60.7±1.5 |
| PSB Rc82 | 22.1±0.8 | 1.91±0.1 | 57.7±1.5 |
| Ciherang-Sub1 | 21.0±0.6 | 1.49±0.2 | 67.4±7.9 |
Supplemental Table 1. Amylose, sugar and starch content were determined using paddy rice and expressed as percentage (weight basis).
| Genotypes | Amylose content (%) | Sugar content (%) | Starch content (%) |
|---|---|---|---|
| PSB Rc82-AG1 | 20.3±0.5 | 1.78±0.2 | 56.6±0.5 |
| PSB Rc82-AG2 | 20.8±1.4 | 2.04±0.1 | 58.4±0.6 |
| PSB Rc82-AG1-AG2 | 22.7±0.9 | 2.12±0.0 | 55.7±0.6 |
| Ciherang-Sub1-AG1 | 21.1±0.2 | 1.31±0.1 | 59.4±0.8 |
| Ciherang-Sub1-AG2 | 21.4±0.5 | 1.6±0.1 | 63.7±4.3 |
| Ciherang-Sub1-AG1-AG2 | 20.9±0.4 | 1.23±0.1 | 60.7±1.5 |
| PSB Rc82 | 22.1±0.8 | 1.91±0.1 | 57.7±1.5 |
| Ciherang-Sub1 | 21.0±0.6 | 1.49±0.2 | 67.4±7.9 |
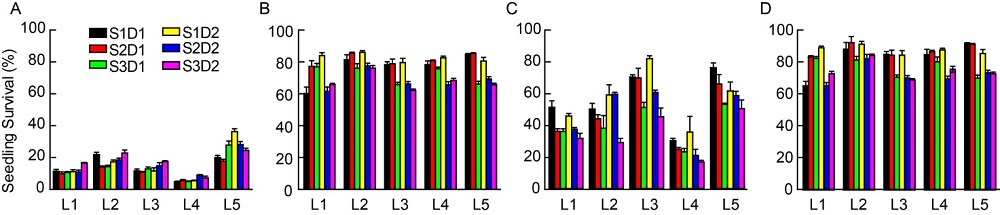
Fig. 2. Effects of seeding rate and depth on survival of rice genotypes at 21 d after seedling.A, Under flooded condition of 3-5 cm water depth in wet season of 2016. B, Under control condition in wet season of 2016. C, Under flooded condition of 3-5 cm water depth in dry season of 2017. D, Under control condition in dry season of 2017.S1, S2 and S3, Seeding rates at 4, 8 and 12 g/m2, respectively; D1 and D2, Depth of seeding with 0.5 and 2.0 cm, respectively. L1, Ciherang-Sub1-AG1; L2, Ciherang-Sub1-AG2; L3, Ciherang-Sub1-AG1-AG2; L4, Ciherang-Sub1; L5, Ma-Zhan Red.Data indicate Mean ± SE (n = 3).
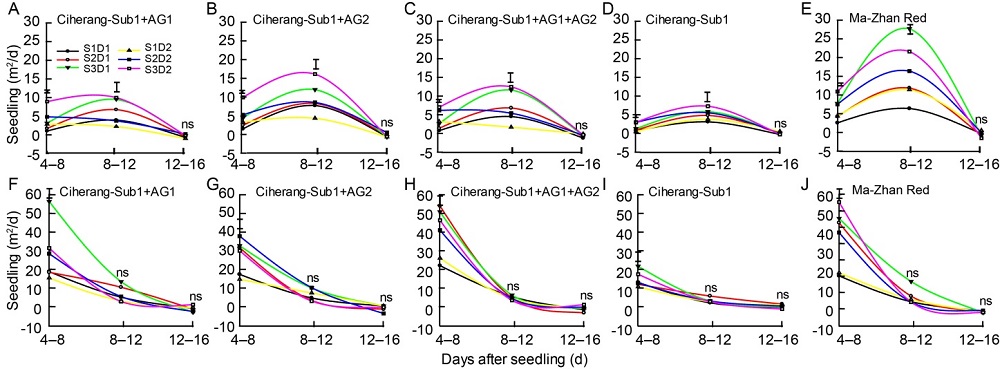
Fig. 3. Effects of seeding rate and depth on germination rate of rice genotypes under the flooded condition.A-E, Wet season in 2016. F-J, Dry season in 2017. S1, S2 and S3, Seeding rates at 4, 8 and 12 g/m2, respectively; D1 and D2, Depths of seeding with 0.5 and 2.0 cm, respectively. ns, No significance; Vertical bars indicate significant difference at the LSD0.05 level (n = 3).
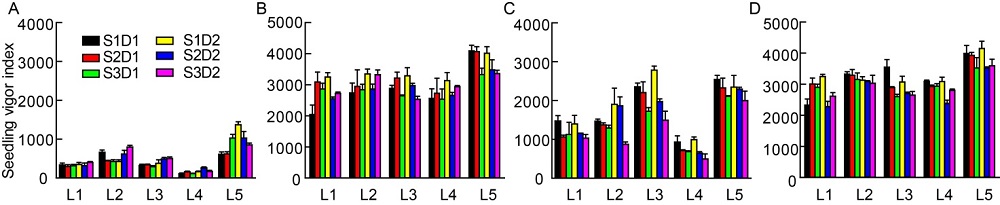
Fig. 4. Effect of seeding rate and depth on rice seedling vigor index at 28 d after seedling.A, Under flooded condition of 3-5 cm water depth in wet season 2016. B, Under control condition in wet season 2016. C, Under flooded condition of 3-5 cm water depth in dry season of 2017. D, Under control condition in dry season of 2017.L1, Ciherang-Sub1-AG1; L2, Ciherang-Sub1-AG2; L3, Ciherang-Sub1-AG1-AG2; L4, Ciherang-Sub1; L5, Ma-Zhan Red. S1, S2 and S3, Seeding rate at 4, 8 and 12 g/m2, respectively; D1 and D2, Depth of seeding with 0.5 cm and 2.0 cm, respectively. Data are Mean ± SE (n = 3).
| Genotype | Control | Flooded | |||||||||||||
|---|---|---|---|---|---|---|---|---|---|---|---|---|---|---|---|
| D1 | D2 | D1 | D2 | ||||||||||||
| S1 | S2 | S3 | S1 | S2 | S3 | S1 | S2 | S3 | S1 | S2 | S3 | ||||
| Wet season in 2016 | |||||||||||||||
| Ciherang-Sub1-AG1 | 9.2 | 11.8 | 8.7 | 11.2 | 12.5 | 12.7 | 4.2 | 2.3 | 3.4 | 4.1 | 5.8 | 3.8 | |||
| Ciherang-Sub1-AG2 | 9.6 | 10.9 | 10.4 | 11.2 | 10.2 | 10.6 | 4.7 | 4.7 | 3.5 | 4.0 | 6.6 | 8.4 | |||
| Ciherang-Sub1-AG1-AG2 | 9.6 | 9.9 | 12.0 | 13.0 | 11.1 | 13.9 | 3.8 | 3.5 | 2.9 | 4.9 | 6.5 | 6.2 | |||
| Ciherang-Sub1 | 10.0 | 11.0 | 10.5 | 13.6 | 12.3 | 15.2 | 2.6 | 3.7 | 2.7 | 2.5 | 4.4 | 4.4 | |||
| Ma-Zhan Red | 12.4 | 11.7 | 13.5 | 10.9 | 12.4 | 15.9 | 3.8 | 4.1 | 6.7 | 5.6 | 4.8 | 4.7 | |||
| Mean | 10.2 | 11.1 | 11.0 | 12.0 | 11.7 | 13.7 | 3.8 | 3.7 | 3.9 | 4.2 | 5.6 | 5.5 | |||
| HSD0.05 | ns | ns | ns | ns | ns | ns | 1.0** | 1.0** | 1.0** | 1.0** | 1.0** | 1.0** | |||
| Dry season in 2017 | |||||||||||||||
| Ciherang-Sub1-AG1 | 10.0 | 9.5 | 9.5 | 12.3 | 9.5 | 11.0 | 9.0 | 5.7 | 10.6 | 10.9 | 10.0 | 10.6 | |||
| Ciherang-Sub1-AG2 | 13.8 | 10.5 | 15.4 | 8.6 | 13.8 | 11.0 | 7.5 | 6.9 | 13.2 | 11.8 | 11.4 | 10.0 | |||
| Ciherang-Sub1-AG1-AG2 | 12.3 | 9.3 | 11.8 | 10.2 | 12.2 | 14.7 | 9.7 | 9.8 | 12.5 | 13.7 | 11.8 | 9.7 | |||
| Ciherang-Sub1 | 8.4 | 7.9 | 9.7 | 9.9 | 10.1 | 11.3 | 8.7 | 6.7 | 11.2 | 10.5 | 9.3 | 8.5 | |||
| Ma-Zhan Red | 9.2 | 10.8 | 10.4 | 11.9 | 13.1 | 12.2 | 7.9 | 7.3 | 9.8 | 10.7 | 9.6 | 8.7 | |||
| Mean | 10.7 | 9.6 | 11.3 | 10.6 | 11.7 | 12.0 | 8.6 | 7.3 | 11.4 | 11.5 | 10.4 | 9.5 | |||
| HSD0.05 | ns | ns | ns | ns | ns | ns | 0.84* | 0.84* | 0.84* | 0.84* | 0.84* | 0.84* | |||
Table 3 Effects of seeding rate and depth on specific leaf area of different AG-introgression lines at 21 d after sowing. cm2/g
| Genotype | Control | Flooded | |||||||||||||
|---|---|---|---|---|---|---|---|---|---|---|---|---|---|---|---|
| D1 | D2 | D1 | D2 | ||||||||||||
| S1 | S2 | S3 | S1 | S2 | S3 | S1 | S2 | S3 | S1 | S2 | S3 | ||||
| Wet season in 2016 | |||||||||||||||
| Ciherang-Sub1-AG1 | 9.2 | 11.8 | 8.7 | 11.2 | 12.5 | 12.7 | 4.2 | 2.3 | 3.4 | 4.1 | 5.8 | 3.8 | |||
| Ciherang-Sub1-AG2 | 9.6 | 10.9 | 10.4 | 11.2 | 10.2 | 10.6 | 4.7 | 4.7 | 3.5 | 4.0 | 6.6 | 8.4 | |||
| Ciherang-Sub1-AG1-AG2 | 9.6 | 9.9 | 12.0 | 13.0 | 11.1 | 13.9 | 3.8 | 3.5 | 2.9 | 4.9 | 6.5 | 6.2 | |||
| Ciherang-Sub1 | 10.0 | 11.0 | 10.5 | 13.6 | 12.3 | 15.2 | 2.6 | 3.7 | 2.7 | 2.5 | 4.4 | 4.4 | |||
| Ma-Zhan Red | 12.4 | 11.7 | 13.5 | 10.9 | 12.4 | 15.9 | 3.8 | 4.1 | 6.7 | 5.6 | 4.8 | 4.7 | |||
| Mean | 10.2 | 11.1 | 11.0 | 12.0 | 11.7 | 13.7 | 3.8 | 3.7 | 3.9 | 4.2 | 5.6 | 5.5 | |||
| HSD0.05 | ns | ns | ns | ns | ns | ns | 1.0** | 1.0** | 1.0** | 1.0** | 1.0** | 1.0** | |||
| Dry season in 2017 | |||||||||||||||
| Ciherang-Sub1-AG1 | 10.0 | 9.5 | 9.5 | 12.3 | 9.5 | 11.0 | 9.0 | 5.7 | 10.6 | 10.9 | 10.0 | 10.6 | |||
| Ciherang-Sub1-AG2 | 13.8 | 10.5 | 15.4 | 8.6 | 13.8 | 11.0 | 7.5 | 6.9 | 13.2 | 11.8 | 11.4 | 10.0 | |||
| Ciherang-Sub1-AG1-AG2 | 12.3 | 9.3 | 11.8 | 10.2 | 12.2 | 14.7 | 9.7 | 9.8 | 12.5 | 13.7 | 11.8 | 9.7 | |||
| Ciherang-Sub1 | 8.4 | 7.9 | 9.7 | 9.9 | 10.1 | 11.3 | 8.7 | 6.7 | 11.2 | 10.5 | 9.3 | 8.5 | |||
| Ma-Zhan Red | 9.2 | 10.8 | 10.4 | 11.9 | 13.1 | 12.2 | 7.9 | 7.3 | 9.8 | 10.7 | 9.6 | 8.7 | |||
| Mean | 10.7 | 9.6 | 11.3 | 10.6 | 11.7 | 12.0 | 8.6 | 7.3 | 11.4 | 11.5 | 10.4 | 9.5 | |||
| HSD0.05 | ns | ns | ns | ns | ns | ns | 0.84* | 0.84* | 0.84* | 0.84* | 0.84* | 0.84* | |||
| Genotype | Saturated | |||||
|---|---|---|---|---|---|---|
| D1 | D2 | |||||
| Wet season-2016 | 4 g/m2 | 8 g/m2 | 4 g/m2 | 8 g/m2 | 4 g/m2 | 8 g/m2 |
| Ciherang-Sub1-AG1 | 4.4 | 5.8 | 4.2 | 5.2667 | 4.8 | 6.5 |
| Ciherang-Sub1-AG2 | 4.4 | 5.1 | 4.7 | 5.0767 | 4.7 | 5.9 |
| Ciherang-Sub1-AG1-AG2 | 4.1 | 5.0 | 4.8 | 6.08 | 5.5 | 6.0 |
| Ciherang-Sub1 | 4.8 | 4.0 | 3.1 | 4.0833 | 4.2 | 6.7 |
| Ma-Zhan Red | 4.7 | 4.9 | 6.3 | 9.4267 | 6.9 | 8.1 |
| Mean | 4.5 | 5.0 | 4.6 | 6.0 | 5.2 | 6.6 |
| LSD 0.05 | 0.93** | 0.93** | 0.93** | 0.93** | 0.93** | 0.93** |
| Flood | ||||||
| Ciherang-Sub1-AG1 | 1.2 | 1.8 | 1.6 | 1.9 | 1.9 | 1.5 |
| Ciherang-Sub1-AG2 | 2.3 | 2.5 | 1.9 | 1.7 | 1.9 | 2.0 |
| Ciherang-Sub1-AG1-AG2 | 2.0 | 2.3 | 1.9 | 1.4 | 1.5 | 1.6 |
| Ciherang-Sub1 | 1.3 | 1.3 | 1.5 | 1.1 | 1.0 | 1.2 |
| Ma-Zhan Red | 1.9 | 1.8 | 2.0 | 2.3 | 1.5 | 1.2 |
| Mean | 1.8 | 1.9 | 1.8 | 1.7 | 1.6 | 1.5 |
| LSD 0.05 | 0.49* | 0.49* | 0.49* | 0.49* | 0.49* | 0.49* |
| Dry season 2017 | Saturated | |||||
| Ciherang-Sub1-AG1 | 4.6 | 3.9 | 4.9 | 3.9 | 4.1 | 3.7 |
| Ciherang-Sub1-AG2 | 4.6 | 3.9 | 5.2 | 4.4 | 4.9 | 4.4 |
| Ciherang-Sub1-AG1-AG2 | 4.7 | 3.3 | 6.0 | 5.2 | 6.1 | 4.7 |
| Ciherang-Sub1 | 5.4 | 2.4 | 3.6 | 3.0 | 4.0 | 3.7 |
| Ma-Zhan Red | 5.2 | 4.3 | 5.9 | 4.4 | 5.4 | 5.5 |
| Mean | 4.9 | 3.5 | 5.1 | 4.2 | 4.9 | 4.4 |
| LSD 0.05 | ns | ns | ns | ns | ns | ns |
| Flood | ||||||
| Ciherang-Sub1-AG1 | 2.2 | 1.2 | 2.2 | 3.5 | 2.4 | 2.3 |
| Ciherang-Sub1-AG2 | 3.0 | 2.5 | 2.2 | 2.7 | 2.9 | 2.6 |
| Ciherang-Sub1-AG1-AG2 | 3.4 | 2.9 | 2.6 | 2.7 | 3.2 | 2.7 |
| Ciherang-Sub1 | 2.1 | 1.7 | 2.0 | 1.8 | 2.4 | 2.0 |
| Ma-Zhan Red | 2.3 | 2.5 | 2.2 | 2.2 | 2.3 | 2.3 |
| Mean | 2.6 | 2.1 | 2.3 | 2.6 | 2.6 | 2.4 |
| LSD 0.05 | 0.52 | 0.52* | 0.52* | 0.52* | 0.52* | 0.52* |
Supplemental Table 2. Effect of seeding rate and depth on leaf area per plant (cm-2) of different AG-introgression lines at 14 DAS during the wet season of 2016 and dry season 2017.
| Genotype | Saturated | |||||
|---|---|---|---|---|---|---|
| D1 | D2 | |||||
| Wet season-2016 | 4 g/m2 | 8 g/m2 | 4 g/m2 | 8 g/m2 | 4 g/m2 | 8 g/m2 |
| Ciherang-Sub1-AG1 | 4.4 | 5.8 | 4.2 | 5.2667 | 4.8 | 6.5 |
| Ciherang-Sub1-AG2 | 4.4 | 5.1 | 4.7 | 5.0767 | 4.7 | 5.9 |
| Ciherang-Sub1-AG1-AG2 | 4.1 | 5.0 | 4.8 | 6.08 | 5.5 | 6.0 |
| Ciherang-Sub1 | 4.8 | 4.0 | 3.1 | 4.0833 | 4.2 | 6.7 |
| Ma-Zhan Red | 4.7 | 4.9 | 6.3 | 9.4267 | 6.9 | 8.1 |
| Mean | 4.5 | 5.0 | 4.6 | 6.0 | 5.2 | 6.6 |
| LSD 0.05 | 0.93** | 0.93** | 0.93** | 0.93** | 0.93** | 0.93** |
| Flood | ||||||
| Ciherang-Sub1-AG1 | 1.2 | 1.8 | 1.6 | 1.9 | 1.9 | 1.5 |
| Ciherang-Sub1-AG2 | 2.3 | 2.5 | 1.9 | 1.7 | 1.9 | 2.0 |
| Ciherang-Sub1-AG1-AG2 | 2.0 | 2.3 | 1.9 | 1.4 | 1.5 | 1.6 |
| Ciherang-Sub1 | 1.3 | 1.3 | 1.5 | 1.1 | 1.0 | 1.2 |
| Ma-Zhan Red | 1.9 | 1.8 | 2.0 | 2.3 | 1.5 | 1.2 |
| Mean | 1.8 | 1.9 | 1.8 | 1.7 | 1.6 | 1.5 |
| LSD 0.05 | 0.49* | 0.49* | 0.49* | 0.49* | 0.49* | 0.49* |
| Dry season 2017 | Saturated | |||||
| Ciherang-Sub1-AG1 | 4.6 | 3.9 | 4.9 | 3.9 | 4.1 | 3.7 |
| Ciherang-Sub1-AG2 | 4.6 | 3.9 | 5.2 | 4.4 | 4.9 | 4.4 |
| Ciherang-Sub1-AG1-AG2 | 4.7 | 3.3 | 6.0 | 5.2 | 6.1 | 4.7 |
| Ciherang-Sub1 | 5.4 | 2.4 | 3.6 | 3.0 | 4.0 | 3.7 |
| Ma-Zhan Red | 5.2 | 4.3 | 5.9 | 4.4 | 5.4 | 5.5 |
| Mean | 4.9 | 3.5 | 5.1 | 4.2 | 4.9 | 4.4 |
| LSD 0.05 | ns | ns | ns | ns | ns | ns |
| Flood | ||||||
| Ciherang-Sub1-AG1 | 2.2 | 1.2 | 2.2 | 3.5 | 2.4 | 2.3 |
| Ciherang-Sub1-AG2 | 3.0 | 2.5 | 2.2 | 2.7 | 2.9 | 2.6 |
| Ciherang-Sub1-AG1-AG2 | 3.4 | 2.9 | 2.6 | 2.7 | 3.2 | 2.7 |
| Ciherang-Sub1 | 2.1 | 1.7 | 2.0 | 1.8 | 2.4 | 2.0 |
| Ma-Zhan Red | 2.3 | 2.5 | 2.2 | 2.2 | 2.3 | 2.3 |
| Mean | 2.6 | 2.1 | 2.3 | 2.6 | 2.6 | 2.4 |
| LSD 0.05 | 0.52 | 0.52* | 0.52* | 0.52* | 0.52* | 0.52* |
| Genotype | Saturated | |||||
|---|---|---|---|---|---|---|
| D1 | D2 | |||||
| Wet season 2016 | 4 g/m2 | 8 g/m2 | 4 g/m2 | 8 g/m2 | 4 g/m2 | 8 g/m2 |
| Ciherang-Sub1-AG1 | 303.4 | 988 | 1206.6 | 437 | 577.4 | 1181.2 |
| Ciherang-Sub1-AG2 | 420.5 | 972.8 | 1016.1 | 446.7 | 614.4 | 1288 |
| Ciherang-Sub1-AG1-AG2 | 379.3 | 730.4 | 1030 | 461 | 731.1 | 1058.3 |
| Ciherang-Sub1 | 400.5 | 761.3 | 1076 | 421.4 | 635.7 | 1290.6 |
| Ma-Zhan Red | 521.7 | 1139.4 | 1341.5 | 594.4 | 1038.5 | 1710 |
| Mean | 405.1 | 918.4 | 1134 | 472.1 | 719.4 | 1305.6 |
| LSD 0.05 | ns | ns | ns | ns | ns | ns |
| Flood | ||||||
| Ciherang-Sub1-AG1 | 45.6 | 82.7 | 139.7 | 52.6 | 95.5 | 159.4 |
| Ciherang-Sub1-AG2 | 76.6 | 117.6 | 168.1 | 64.3 | 115.8 | 244.9 |
| Ciherang-Sub1-AG1-AG2 | 66.3 | 82.6 | 135.6 | 53.9 | 112.4 | 201 |
| Ciherang-Sub1 | 18.5 | 39.8 | 60.8 | 25.2 | 77.2 | 74.3 |
| Ma-Zhan Red | 65.2 | 153.4 | 297.6 | 141.4 | 202.8 | 284.2 |
| Mean | 54.4 | 95.2 | 160.4 | 67.5 | 120.7 | 192.8 |
| LSD 0.05 | 39.1** | 39.1** | 39.1** | 39.1** | 39.1** | 39.1** |
| Dry season 2017 | Saturated | |||||
| Ciherang-Sub1-AG1 | 378.4 | 861.9 | 1305.8 | 500.4 | 766.3 | 1167.5 |
| Ciherang-Sub1-AG2 | 461.6 | 859.2 | 1317.8 | 413.5 | 961.4 | 1315.4 |
| Ciherang-Sub1-AG1-AG2 | 491.4 | 679.6 | 1210.6 | 492.9 | 884.7 | 1037.9 |
| Ciherang-Sub1 | 553.1 | 843.6 | 1272.9 | 407.7 | 768.4 | 1187.7 |
| Ma-Zhan Red | 569.7 | 1014.7 | 1376.6 | 506.8 | 953.6 | 1761.3 |
| Mean | 490.8 | 851.8 | 1296.7 | 464.3 | 866.9 | 1294 |
| LSD 0.05 | ns | ns | ns | ns | ns | ns |
| Flood | ||||||
| Ciherang-Sub1-AG1 | 260.9 | 292.8 | 716 | 212 | 367.4 | 354 |
| Ciherang-Sub1-AG2 | 241.6 | 420 | 389.6 | 232.9 | 536.2 | 363 |
| Ciherang-Sub1-AG1-AG2 | 302.4 | 607.1 | 602.1 | 312 | 527.7 | 548 |
| Ciherang-Sub1 | 152 | 175.7 | 249.4 | 134.1 | 169.3 | 195.7 |
| Ma-Zhan Red | 314.3 | 670 | 704.2 | 268.4 | 572.4 | 787.7 |
| Mean | 254.2 | 433.1 | 532.3 | 231.9 | 434.6 | 449.7 |
| LSD 0.05 | 121.4* | 121.4* | 121.4* | 121.4* | 121.4* | 121.4* |
Supplemental Table 3. Effect of seeding rate and depth on leaf no per m2 of different AG introgression lines at 14 DAS during the wet season 2016 and dry season 2017.
| Genotype | Saturated | |||||
|---|---|---|---|---|---|---|
| D1 | D2 | |||||
| Wet season 2016 | 4 g/m2 | 8 g/m2 | 4 g/m2 | 8 g/m2 | 4 g/m2 | 8 g/m2 |
| Ciherang-Sub1-AG1 | 303.4 | 988 | 1206.6 | 437 | 577.4 | 1181.2 |
| Ciherang-Sub1-AG2 | 420.5 | 972.8 | 1016.1 | 446.7 | 614.4 | 1288 |
| Ciherang-Sub1-AG1-AG2 | 379.3 | 730.4 | 1030 | 461 | 731.1 | 1058.3 |
| Ciherang-Sub1 | 400.5 | 761.3 | 1076 | 421.4 | 635.7 | 1290.6 |
| Ma-Zhan Red | 521.7 | 1139.4 | 1341.5 | 594.4 | 1038.5 | 1710 |
| Mean | 405.1 | 918.4 | 1134 | 472.1 | 719.4 | 1305.6 |
| LSD 0.05 | ns | ns | ns | ns | ns | ns |
| Flood | ||||||
| Ciherang-Sub1-AG1 | 45.6 | 82.7 | 139.7 | 52.6 | 95.5 | 159.4 |
| Ciherang-Sub1-AG2 | 76.6 | 117.6 | 168.1 | 64.3 | 115.8 | 244.9 |
| Ciherang-Sub1-AG1-AG2 | 66.3 | 82.6 | 135.6 | 53.9 | 112.4 | 201 |
| Ciherang-Sub1 | 18.5 | 39.8 | 60.8 | 25.2 | 77.2 | 74.3 |
| Ma-Zhan Red | 65.2 | 153.4 | 297.6 | 141.4 | 202.8 | 284.2 |
| Mean | 54.4 | 95.2 | 160.4 | 67.5 | 120.7 | 192.8 |
| LSD 0.05 | 39.1** | 39.1** | 39.1** | 39.1** | 39.1** | 39.1** |
| Dry season 2017 | Saturated | |||||
| Ciherang-Sub1-AG1 | 378.4 | 861.9 | 1305.8 | 500.4 | 766.3 | 1167.5 |
| Ciherang-Sub1-AG2 | 461.6 | 859.2 | 1317.8 | 413.5 | 961.4 | 1315.4 |
| Ciherang-Sub1-AG1-AG2 | 491.4 | 679.6 | 1210.6 | 492.9 | 884.7 | 1037.9 |
| Ciherang-Sub1 | 553.1 | 843.6 | 1272.9 | 407.7 | 768.4 | 1187.7 |
| Ma-Zhan Red | 569.7 | 1014.7 | 1376.6 | 506.8 | 953.6 | 1761.3 |
| Mean | 490.8 | 851.8 | 1296.7 | 464.3 | 866.9 | 1294 |
| LSD 0.05 | ns | ns | ns | ns | ns | ns |
| Flood | ||||||
| Ciherang-Sub1-AG1 | 260.9 | 292.8 | 716 | 212 | 367.4 | 354 |
| Ciherang-Sub1-AG2 | 241.6 | 420 | 389.6 | 232.9 | 536.2 | 363 |
| Ciherang-Sub1-AG1-AG2 | 302.4 | 607.1 | 602.1 | 312 | 527.7 | 548 |
| Ciherang-Sub1 | 152 | 175.7 | 249.4 | 134.1 | 169.3 | 195.7 |
| Ma-Zhan Red | 314.3 | 670 | 704.2 | 268.4 | 572.4 | 787.7 |
| Mean | 254.2 | 433.1 | 532.3 | 231.9 | 434.6 | 449.7 |
| LSD 0.05 | 121.4* | 121.4* | 121.4* | 121.4* | 121.4* | 121.4* |
| Genotype | Control | Flooded | |||||||||||||
|---|---|---|---|---|---|---|---|---|---|---|---|---|---|---|---|
| D1 | D2 | D1 | D2 | ||||||||||||
| S1 | S2 | S3 | S1 | S2 | S3 | S1 | S2 | S3 | S1 | S2 | S3 | ||||
| Wet season in 2016 | |||||||||||||||
| Ciherang-Sub1-AG1 | 465.0 | 1299.5 | 1657.9 | 744.2 | 903.0 | 1743.3 | 67.2 | 123.2 | 206.9 | 76.9 | 126.3 | 246.3 | |||
| Ciherang-Sub1-AG2 | 580.9 | 1482.3 | 1736.5 | 700.0 | 1201.7 | 1937.6 | 133.4 | 138.0 | 284.1 | 90.5 | 264.2 | 482.2 | |||
| Ciherang-Sub1-AG1-AG2 | 578.4 | 1129.1 | 1512.1 | 618.2 | 1137.4 | 1840.1 | 66.1 | 103.6 | 153.8 | 65.5 | 175.9 | 298.7 | |||
| Ciherang-Sub1 | 494.8 | 1012.9 | 1525.5 | 654.9 | 1082.7 | 1555.0 | 16.5 | 51.9 | 101.1 | 18.9 | 96.2 | 113.7 | |||
| Ma-Zhan Red | 842.4 | 1545.6 | 1808.9 | 893.8 | 1538.9 | 2041.5 | 137.1 | 230.5 | 632.3 | 258.9 | 358.2 | 469.8 | |||
| Mean | 592.3 | 1293.9 | 1648.2 | 722.2 | 1172.7 | 1823.5 | 84.0 | 129.4 | 275.7 | 102.2 | 204.2 | 322.1 | |||
| HSD0.05 | 222.5* | 222.5* | 222.5* | 222.5* | 222.5* | 222.5* | 81.3** | 81.3** | 81.3** | 81.3** | 81.3** | 81.3** | |||
| Dry season in 2017 | |||||||||||||||
| Ciherang-Sub1-AG1 | 629.0 | 1610.2 | 1978.1 | 1032.6 | 1212.7 | 2158.3 | 478.1 | 549.0 | 1779.3 | 553.2 | 742.1 | 1024.7 | |||
| Ciherang-Sub1-AG2 | 1026.7 | 1759.7 | 2678.3 | 835.9 | 1803.6 | 2304.6 | 486.6 | 813.8 | 1266.6 | 668.7 | 1144.6 | 894.4 | |||
| Ciherang-Sub1-AG1-AG2 | 954.0 | 1555.4 | 2020.9 | 864.8 | 1470.8 | 2086.3 | 590.8 | 1267.6 | 1632.0 | 942.9 | 1282.9 | 1357.1 | |||
| Ciherang-Sub1 | 799.4 | 1556.6 | 2145.7 | 860.3 | 1394.3 | 2018.6 | 305.6 | 412.2 | 725.1 | 335.0 | 386.6 | 447.0 | |||
| Ma-Zhan Red | 1043.3 | 1786.8 | 2358.5 | 1030.4 | 1902.6 | 2358.1 | 509.5 | 1323.4 | 1693.0 | 683.8 | 1052.7 | 1447.8 | |||
| Mean | 890.5 | 1653.7 | 2236.3 | 924.8 | 1556.8 | 2185.2 | 474.1 | 873.2 | 1419.2 | 636.7 | 921.8 | 1034.2 | |||
| HSD0.05 | ns | ns | ns | ns | ns | ns | 241.4* | 241.4* | 241.4* | 241.4* | 241.4* | 241.4* | |||
Table 4 Effects of seeding rate and depth on leaf number per square of different AG-introgression lines at 21 d after sowing.
| Genotype | Control | Flooded | |||||||||||||
|---|---|---|---|---|---|---|---|---|---|---|---|---|---|---|---|
| D1 | D2 | D1 | D2 | ||||||||||||
| S1 | S2 | S3 | S1 | S2 | S3 | S1 | S2 | S3 | S1 | S2 | S3 | ||||
| Wet season in 2016 | |||||||||||||||
| Ciherang-Sub1-AG1 | 465.0 | 1299.5 | 1657.9 | 744.2 | 903.0 | 1743.3 | 67.2 | 123.2 | 206.9 | 76.9 | 126.3 | 246.3 | |||
| Ciherang-Sub1-AG2 | 580.9 | 1482.3 | 1736.5 | 700.0 | 1201.7 | 1937.6 | 133.4 | 138.0 | 284.1 | 90.5 | 264.2 | 482.2 | |||
| Ciherang-Sub1-AG1-AG2 | 578.4 | 1129.1 | 1512.1 | 618.2 | 1137.4 | 1840.1 | 66.1 | 103.6 | 153.8 | 65.5 | 175.9 | 298.7 | |||
| Ciherang-Sub1 | 494.8 | 1012.9 | 1525.5 | 654.9 | 1082.7 | 1555.0 | 16.5 | 51.9 | 101.1 | 18.9 | 96.2 | 113.7 | |||
| Ma-Zhan Red | 842.4 | 1545.6 | 1808.9 | 893.8 | 1538.9 | 2041.5 | 137.1 | 230.5 | 632.3 | 258.9 | 358.2 | 469.8 | |||
| Mean | 592.3 | 1293.9 | 1648.2 | 722.2 | 1172.7 | 1823.5 | 84.0 | 129.4 | 275.7 | 102.2 | 204.2 | 322.1 | |||
| HSD0.05 | 222.5* | 222.5* | 222.5* | 222.5* | 222.5* | 222.5* | 81.3** | 81.3** | 81.3** | 81.3** | 81.3** | 81.3** | |||
| Dry season in 2017 | |||||||||||||||
| Ciherang-Sub1-AG1 | 629.0 | 1610.2 | 1978.1 | 1032.6 | 1212.7 | 2158.3 | 478.1 | 549.0 | 1779.3 | 553.2 | 742.1 | 1024.7 | |||
| Ciherang-Sub1-AG2 | 1026.7 | 1759.7 | 2678.3 | 835.9 | 1803.6 | 2304.6 | 486.6 | 813.8 | 1266.6 | 668.7 | 1144.6 | 894.4 | |||
| Ciherang-Sub1-AG1-AG2 | 954.0 | 1555.4 | 2020.9 | 864.8 | 1470.8 | 2086.3 | 590.8 | 1267.6 | 1632.0 | 942.9 | 1282.9 | 1357.1 | |||
| Ciherang-Sub1 | 799.4 | 1556.6 | 2145.7 | 860.3 | 1394.3 | 2018.6 | 305.6 | 412.2 | 725.1 | 335.0 | 386.6 | 447.0 | |||
| Ma-Zhan Red | 1043.3 | 1786.8 | 2358.5 | 1030.4 | 1902.6 | 2358.1 | 509.5 | 1323.4 | 1693.0 | 683.8 | 1052.7 | 1447.8 | |||
| Mean | 890.5 | 1653.7 | 2236.3 | 924.8 | 1556.8 | 2185.2 | 474.1 | 873.2 | 1419.2 | 636.7 | 921.8 | 1034.2 | |||
| HSD0.05 | ns | ns | ns | ns | ns | ns | 241.4* | 241.4* | 241.4* | 241.4* | 241.4* | 241.4* | |||
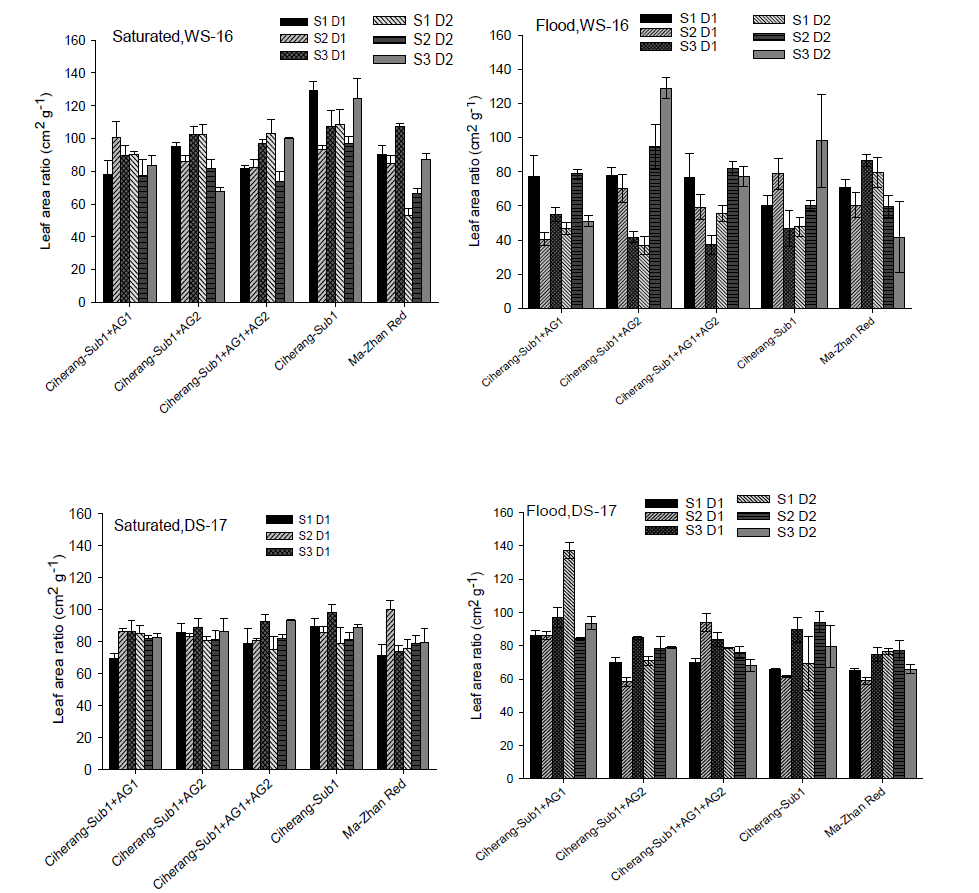
Supplemental Fig. 1. Leaf area ratio (LAR) of rice seedling with different seeding rate and depth at 21 days after sowing under control and flooded condition during wet season 2016 and dry season 2017. S1, S2 and S3, Seeding rate at 4, 8 and 12 g/m2, respectively; D1 and D2, Depth of seeding with 0.5 cm and 2.0 cm, respectively. Vertical bars indicate Mean ± SE (n = 3).
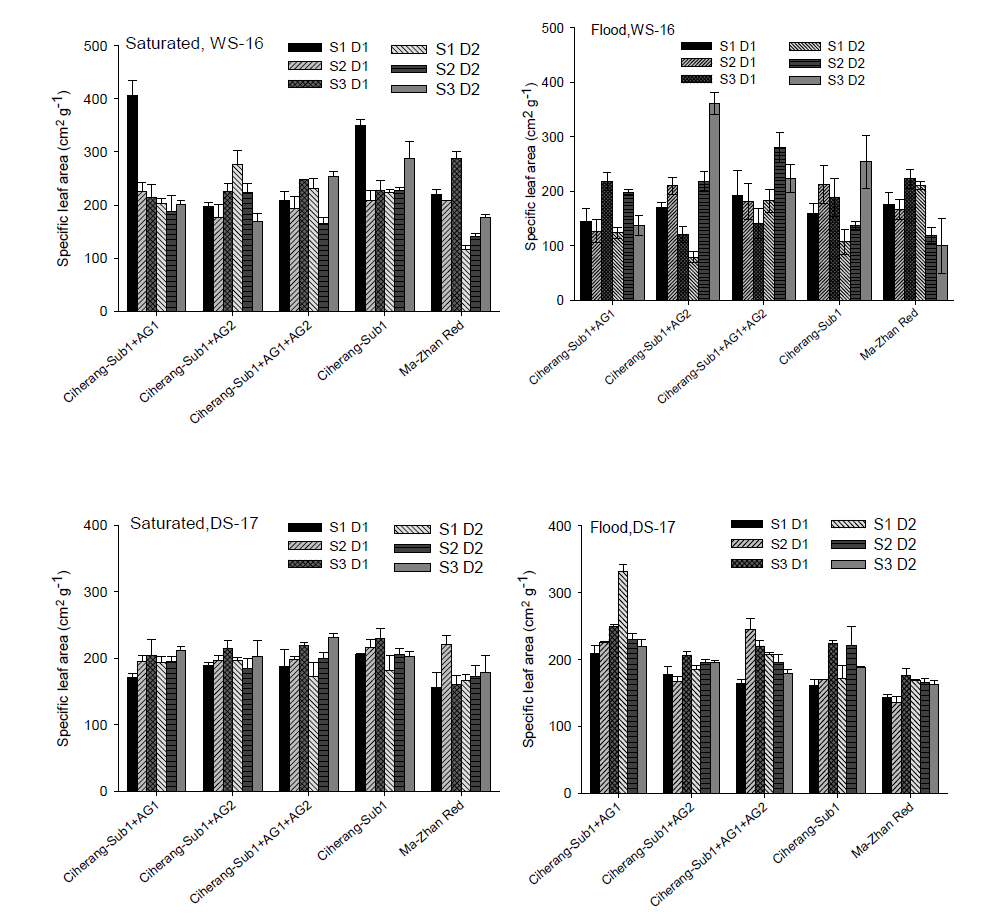
Supplemental Fig. 2. Specific leaf area (SLA) of rice seedling with different seeding rate and depth at 21 days after sowing under control and flooded condition during wet season 2016 and dry season 2017.S1, S2 and S3, Seeding rate at 4, 8 and 12 g/m2, respectively; D1 and D2, Depth of seeding with 0.5 cm and 2.0 cm, respectively. Vertical bars indicate Mean ± SE (n = 3).
| Trait | Genotype | Control | Flooded | |||||||||||||
|---|---|---|---|---|---|---|---|---|---|---|---|---|---|---|---|---|
| D1 | D2 | D1 | D2 | |||||||||||||
| S1 | S2 | S3 | S1 | S2 | S3 | S1 | S2 | S3 | S1 | S2 | S3 | |||||
| Leaf dry weight | Wet season in 2016 | |||||||||||||||
| Ciherang-Sub1-AG1 | 4.7 | 11.8 | 14.2 | 6.8 | 12.1 | 18.2 | 0.5 | 0.6 | 0.7 | 0.5 | 0.9 | 2.1 | ||||
| Ciherang-Sub1-AG2 | 5.6 | 15.4 | 15.5 | 5.0 | 10.1 | 20.6 | 0.9 | 0.9 | 1.8 | 1.3 | 1.6 | 2.3 | ||||
| Ciherang-Sub1-AG1-AG2 | 5.2 | 11.6 | 13.8 | 6.5 | 12.8 | 14.8 | 0.4 | 0.6 | 1.2 | 0.5 | 1.0 | 2.2 | ||||
| Ciherang-Sub1 | 3.3 | 12.7 | 15.4 | 7.4 | 10.4 | 16.2 | 0.1 | 0.3 | 0.3 | 0.2 | 0.8 | 0.6 | ||||
| Ma-Zhan Red | 7.9 | 16.0 | 15.5 | 12.4 | 20.1 | 29.4 | 0.8 | 1.4 | 4.1 | 1.6 | 3.8 | 3.9 | ||||
| Mean | 5.4 | 13.5 | 14.9 | 7.6 | 13.1 | 19.8 | 0.5 | 0.8 | 1.6 | 0.8 | 1.6 | 2.2 | ||||
| HSD0.05 | 3.53** | 0.46*** | ||||||||||||||
| Dry season in 2017 | ||||||||||||||||
| Ciherang-Sub1-AG1 | 5.0 | 11.9 | 15.9 | 8.2 | 9.8 | 17.3 | 3.9 | 3.6 | 13.4 | 4.0 | 5.6 | 7.5 | ||||
| Ciherang-Sub1-AG2 | 8.5 | 12.8 | 23.3 | 6.2 | 15.5 | 19.7 | 3.4 | 5.1 | 9.6 | 5.9 | 8.8 | 6.6 | ||||
| Ciherang-Sub1-AG1-AG2 | 8.0 | 11.4 | 16.3 | 7.1 | 12.4 | 18.9 | 5.1 | 8.2 | 12.6 | 7.8 | 10.5 | 10.7 | ||||
| Ciherang-Sub1 | 6.1 | 10.3 | 17.0 | 6.7 | 10.5 | 17.9 | 1.9 | 2.1 | 4.5 | 1.7 | 2.5 | 2.9 | ||||
| Ma-Zhan Red | 8.6 | 15.0 | 22.5 | 10.0 | 18.4 | 24.2 | 4.2 | 11.7 | 14.8 | 6.4 | 11.1 | 13.5 | ||||
| Mean | 7.2 | 12.3 | 19.0 | 7.6 | 13.3 | 19.6 | 3.7 | 6.1 | 11.0 | 5.1 | 7.7 | 8.2 | ||||
| HSD0.05 | ns | 2.24* | ||||||||||||||
| Stem dry weight | Wet season in 2016 | |||||||||||||||
| Ciherang-Sub1-AG1 | 3.9 | 10.2 | 12.0 | 5.8 | 12.0 | 16.8 | 0.3 | 0.8 | 1.4 | 0.6 | 1.0 | 2.3 | ||||
| Ciherang-Sub1-AG2 | 4.1 | 11.1 | 11.6 | 5.6 | 11.2 | 20.9 | 0.6 | 1.3 | 2.1 | 0.9 | 1.5 | 2.7 | ||||
| Ciherang-Sub1-AG1-AG2 | 5.1 | 10.0 | 14.2 | 5.5 | 10.6 | 15.2 | 0.3 | 0.8 | 2.0 | 0.7 | 1.5 | 2.5 | ||||
| Ciherang-Sub1 | 3.3 | 10.9 | 11.3 | 5.5 | 9.6 | 14.3 | 0.1 | 0.3 | 0.6 | 0.2 | 0.7 | 0.6 | ||||
| Ma-Zhan Red | 8.3 | 16.1 | 18.2 | 11.1 | 16.0 | 21.8 | 0.7 | 1.6 | 4.4 | 2.1 | 2.7 | 3.5 | ||||
| Mean | 4.9 | 11.7 | 13.5 | 6.7 | 11.9 | 17.8 | 0.4 | 1.0 | 2.1 | 0.9 | 1.5 | 2.3 | ||||
| HSD0.05 | ns | 0.47* | ||||||||||||||
| Dry season in 2017 | ||||||||||||||||
| Ciherang-Sub1-AG1 | 4.5 | 11.5 | 15.3 | 7.7 | 8.9 | 15.6 | 3.5 | 4.7 | 13.0 | 3.9 | 5.4 | 7.1 | ||||
| Ciherang-Sub1-AG2 | 7.2 | 12.9 | 21.9 | 5.7 | 14.7 | 18.6 | 3.2 | 6.3 | 9.2 | 5.5 | 8.3 | 5.7 | ||||
| Ciherang-Sub1-AG1-AG2 | 7.2 | 10.7 | 14.2 | 6.3 | 12.1 | 17.4 | 4.8 | 8.8 | 13.1 | 7.8 | 10.2 | 10.7 | ||||
| Ciherang-Sub1 | 6.2 | 9.5 | 16.4 | 6.1 | 10.0 | 17.0 | 1.6 | 2.2 | 4.5 | 1.6 | 2.6 | 2.4 | ||||
| Ma-Zhan Red | 7.4 | 12.3 | 19.2 | 8.7 | 16.1 | 22.2 | 3.7 | 9.8 | 13.9 | 5.8 | 9.3 | 12.1 | ||||
| Mean | 6.5 | 11.4 | 17.4 | 6.9 | 12.4 | 18.2 | 3.4 | 6.4 | 10.8 | 4.9 | 7.2 | 7.6 | ||||
| HSD0.05 | ns | ns | ||||||||||||||
Table 5 Effects of seeding rate and depth on leaf and stem dry weight at 21 d after sowing under control and flooded conditions. g/m2
| Trait | Genotype | Control | Flooded | |||||||||||||
|---|---|---|---|---|---|---|---|---|---|---|---|---|---|---|---|---|
| D1 | D2 | D1 | D2 | |||||||||||||
| S1 | S2 | S3 | S1 | S2 | S3 | S1 | S2 | S3 | S1 | S2 | S3 | |||||
| Leaf dry weight | Wet season in 2016 | |||||||||||||||
| Ciherang-Sub1-AG1 | 4.7 | 11.8 | 14.2 | 6.8 | 12.1 | 18.2 | 0.5 | 0.6 | 0.7 | 0.5 | 0.9 | 2.1 | ||||
| Ciherang-Sub1-AG2 | 5.6 | 15.4 | 15.5 | 5.0 | 10.1 | 20.6 | 0.9 | 0.9 | 1.8 | 1.3 | 1.6 | 2.3 | ||||
| Ciherang-Sub1-AG1-AG2 | 5.2 | 11.6 | 13.8 | 6.5 | 12.8 | 14.8 | 0.4 | 0.6 | 1.2 | 0.5 | 1.0 | 2.2 | ||||
| Ciherang-Sub1 | 3.3 | 12.7 | 15.4 | 7.4 | 10.4 | 16.2 | 0.1 | 0.3 | 0.3 | 0.2 | 0.8 | 0.6 | ||||
| Ma-Zhan Red | 7.9 | 16.0 | 15.5 | 12.4 | 20.1 | 29.4 | 0.8 | 1.4 | 4.1 | 1.6 | 3.8 | 3.9 | ||||
| Mean | 5.4 | 13.5 | 14.9 | 7.6 | 13.1 | 19.8 | 0.5 | 0.8 | 1.6 | 0.8 | 1.6 | 2.2 | ||||
| HSD0.05 | 3.53** | 0.46*** | ||||||||||||||
| Dry season in 2017 | ||||||||||||||||
| Ciherang-Sub1-AG1 | 5.0 | 11.9 | 15.9 | 8.2 | 9.8 | 17.3 | 3.9 | 3.6 | 13.4 | 4.0 | 5.6 | 7.5 | ||||
| Ciherang-Sub1-AG2 | 8.5 | 12.8 | 23.3 | 6.2 | 15.5 | 19.7 | 3.4 | 5.1 | 9.6 | 5.9 | 8.8 | 6.6 | ||||
| Ciherang-Sub1-AG1-AG2 | 8.0 | 11.4 | 16.3 | 7.1 | 12.4 | 18.9 | 5.1 | 8.2 | 12.6 | 7.8 | 10.5 | 10.7 | ||||
| Ciherang-Sub1 | 6.1 | 10.3 | 17.0 | 6.7 | 10.5 | 17.9 | 1.9 | 2.1 | 4.5 | 1.7 | 2.5 | 2.9 | ||||
| Ma-Zhan Red | 8.6 | 15.0 | 22.5 | 10.0 | 18.4 | 24.2 | 4.2 | 11.7 | 14.8 | 6.4 | 11.1 | 13.5 | ||||
| Mean | 7.2 | 12.3 | 19.0 | 7.6 | 13.3 | 19.6 | 3.7 | 6.1 | 11.0 | 5.1 | 7.7 | 8.2 | ||||
| HSD0.05 | ns | 2.24* | ||||||||||||||
| Stem dry weight | Wet season in 2016 | |||||||||||||||
| Ciherang-Sub1-AG1 | 3.9 | 10.2 | 12.0 | 5.8 | 12.0 | 16.8 | 0.3 | 0.8 | 1.4 | 0.6 | 1.0 | 2.3 | ||||
| Ciherang-Sub1-AG2 | 4.1 | 11.1 | 11.6 | 5.6 | 11.2 | 20.9 | 0.6 | 1.3 | 2.1 | 0.9 | 1.5 | 2.7 | ||||
| Ciherang-Sub1-AG1-AG2 | 5.1 | 10.0 | 14.2 | 5.5 | 10.6 | 15.2 | 0.3 | 0.8 | 2.0 | 0.7 | 1.5 | 2.5 | ||||
| Ciherang-Sub1 | 3.3 | 10.9 | 11.3 | 5.5 | 9.6 | 14.3 | 0.1 | 0.3 | 0.6 | 0.2 | 0.7 | 0.6 | ||||
| Ma-Zhan Red | 8.3 | 16.1 | 18.2 | 11.1 | 16.0 | 21.8 | 0.7 | 1.6 | 4.4 | 2.1 | 2.7 | 3.5 | ||||
| Mean | 4.9 | 11.7 | 13.5 | 6.7 | 11.9 | 17.8 | 0.4 | 1.0 | 2.1 | 0.9 | 1.5 | 2.3 | ||||
| HSD0.05 | ns | 0.47* | ||||||||||||||
| Dry season in 2017 | ||||||||||||||||
| Ciherang-Sub1-AG1 | 4.5 | 11.5 | 15.3 | 7.7 | 8.9 | 15.6 | 3.5 | 4.7 | 13.0 | 3.9 | 5.4 | 7.1 | ||||
| Ciherang-Sub1-AG2 | 7.2 | 12.9 | 21.9 | 5.7 | 14.7 | 18.6 | 3.2 | 6.3 | 9.2 | 5.5 | 8.3 | 5.7 | ||||
| Ciherang-Sub1-AG1-AG2 | 7.2 | 10.7 | 14.2 | 6.3 | 12.1 | 17.4 | 4.8 | 8.8 | 13.1 | 7.8 | 10.2 | 10.7 | ||||
| Ciherang-Sub1 | 6.2 | 9.5 | 16.4 | 6.1 | 10.0 | 17.0 | 1.6 | 2.2 | 4.5 | 1.6 | 2.6 | 2.4 | ||||
| Ma-Zhan Red | 7.4 | 12.3 | 19.2 | 8.7 | 16.1 | 22.2 | 3.7 | 9.8 | 13.9 | 5.8 | 9.3 | 12.1 | ||||
| Mean | 6.5 | 11.4 | 17.4 | 6.9 | 12.4 | 18.2 | 3.4 | 6.4 | 10.8 | 4.9 | 7.2 | 7.6 | ||||
| HSD0.05 | ns | ns | ||||||||||||||
| Genotype | Saturated | |||||||
|---|---|---|---|---|---|---|---|---|
| D1 | D2 | |||||||
| Wet season-2016 | 4 g/m2 | 8 g/m2 | 12 g/m2 | 4 g/m2 | 8 g/m2 | 12 g/m2 | ||
| Ciherang-Sub1-AG1 | 1.91 | 4.97 | 7.10 | 2.66 | 5.18 | 8.94 | ||
| Ciherang-Sub1-AG2 | 2.03 | 4.53 | 6.62 | 2.87 | 6.24 | 9.91 | ||
| Ciherang-Sub1-AG1-AG2 | 2.92 | 5.56 | 7.43 | 2.65 | 5.25 | 7.34 | ||
| Ciherang-Sub1 | 2.33 | 4.42 | 5.96 | 2.52 | 4.29 | 6.95 | ||
| Ma-Zhan Red | 3.25 | 6.90 | 7.68 | 3.59 | 6.72 | 8.58 | ||
| Mean | 2.5 | 5.3 | 7.0 | 2.9 | 5.5 | 8.3 | ||
| LSD 0.05 | ns | ns | ns | ns | ns | ns | ||
| Flood | ||||||||
| Ciherang-Sub1-AG1 | 0.12 | 0.34 | 0.78 | 0.32 | 0.43 | 1.14 | ||
| Ciherang-Sub1-AG2 | 0.44 | 0.57 | 1.25 | 0.53 | 0.66 | 1.38 | ||
| Ciherang-Sub1-AG1-AG2 | 0.24 | 0.42 | 1.24 | 0.35 | 0.86 | 1.35 | ||
| Ciherang-Sub1 | 0.10 | 0.17 | 0.38 | 0.07 | 0.40 | 0.41 | ||
| Ma-Zhan Red | 0.34 | 0.91 | 2.05 | 0.62 | 1.00 | 1.99 | ||
| Mean | 0.2 | 0.5 | 1.1 | 0.4 | 0.7 | 1.3 | ||
| LSD 0.05 | ns | ns | ns | ns | ns | ns | ||
| Dry season 2017 | Saturated | |||||||
| Ciherang-Sub1-AG1 | 1.65 | 4.93 | 7.16 | 4.18 | 3.59 | 7.81 | ||
| Ciherang-Sub1-AG2 | 3.84 | 6.73 | 10.29 | 2.48 | 8.60 | 7.41 | ||
| Ciherang-Sub1-AG1-AG2 | 3.76 | 5.94 | 8.45 | 2.87 | 5.68 | 11.30 | ||
| Ciherang-Sub1 | 2.58 | 3.35 | 6.50 | 2.49 | 4.47 | 10.94 | ||
| Ma-Zhan Red | 2.95 | 5.70 | 7.32 | 3.14 | 5.85 | 8.35 | ||
| Mean | 3.0 | 5.3 | 7.9 | 3.0 | 5.6 | 9.2 | ||
| LSD 0.05 | ns | ns | ns | ns | ns | ns | ||
| Flood | ||||||||
| Ciherang-Sub1-AG1 | 2.34 | 1.85 | 6.63 | 2.64 | 2.88 | 4.03 | ||
| Ciherang-Sub1-AG2 | 1.70 | 2.73 | 5.11 | 3.53 | 4.05 | 3.28 | ||
| Ciherang-Sub1-AG1-AG2 | 1.93 | 4.27 | 7.46 | 4.89 | 6.30 | 6.56 | ||
| Ciherang-Sub1 | 1.02 | 1.20 | 2.69 | 0.87 | 1.70 | 1.94 | ||
| Ma-Zhan Red | 1.27 | 5.37 | 6.03 | 2.07 | 3.71 | 7.71 | ||
| Mean | 1.7 | 3.1 | 5.6 | 2.8 | 3.7 | 4.7 | ||
| LSD 0.05 | 1.14* | 1.14* | 1.14* | 1.14* | 1.14* | 1.14* | ||
Supplemental Table 4. Root dry weight (g/m2) of 21 DOS with different seeding rate and depth, under (saturated) control and flooded condition in field trials conducted during wet season 2016 and dry season 2017.
| Genotype | Saturated | |||||||
|---|---|---|---|---|---|---|---|---|
| D1 | D2 | |||||||
| Wet season-2016 | 4 g/m2 | 8 g/m2 | 12 g/m2 | 4 g/m2 | 8 g/m2 | 12 g/m2 | ||
| Ciherang-Sub1-AG1 | 1.91 | 4.97 | 7.10 | 2.66 | 5.18 | 8.94 | ||
| Ciherang-Sub1-AG2 | 2.03 | 4.53 | 6.62 | 2.87 | 6.24 | 9.91 | ||
| Ciherang-Sub1-AG1-AG2 | 2.92 | 5.56 | 7.43 | 2.65 | 5.25 | 7.34 | ||
| Ciherang-Sub1 | 2.33 | 4.42 | 5.96 | 2.52 | 4.29 | 6.95 | ||
| Ma-Zhan Red | 3.25 | 6.90 | 7.68 | 3.59 | 6.72 | 8.58 | ||
| Mean | 2.5 | 5.3 | 7.0 | 2.9 | 5.5 | 8.3 | ||
| LSD 0.05 | ns | ns | ns | ns | ns | ns | ||
| Flood | ||||||||
| Ciherang-Sub1-AG1 | 0.12 | 0.34 | 0.78 | 0.32 | 0.43 | 1.14 | ||
| Ciherang-Sub1-AG2 | 0.44 | 0.57 | 1.25 | 0.53 | 0.66 | 1.38 | ||
| Ciherang-Sub1-AG1-AG2 | 0.24 | 0.42 | 1.24 | 0.35 | 0.86 | 1.35 | ||
| Ciherang-Sub1 | 0.10 | 0.17 | 0.38 | 0.07 | 0.40 | 0.41 | ||
| Ma-Zhan Red | 0.34 | 0.91 | 2.05 | 0.62 | 1.00 | 1.99 | ||
| Mean | 0.2 | 0.5 | 1.1 | 0.4 | 0.7 | 1.3 | ||
| LSD 0.05 | ns | ns | ns | ns | ns | ns | ||
| Dry season 2017 | Saturated | |||||||
| Ciherang-Sub1-AG1 | 1.65 | 4.93 | 7.16 | 4.18 | 3.59 | 7.81 | ||
| Ciherang-Sub1-AG2 | 3.84 | 6.73 | 10.29 | 2.48 | 8.60 | 7.41 | ||
| Ciherang-Sub1-AG1-AG2 | 3.76 | 5.94 | 8.45 | 2.87 | 5.68 | 11.30 | ||
| Ciherang-Sub1 | 2.58 | 3.35 | 6.50 | 2.49 | 4.47 | 10.94 | ||
| Ma-Zhan Red | 2.95 | 5.70 | 7.32 | 3.14 | 5.85 | 8.35 | ||
| Mean | 3.0 | 5.3 | 7.9 | 3.0 | 5.6 | 9.2 | ||
| LSD 0.05 | ns | ns | ns | ns | ns | ns | ||
| Flood | ||||||||
| Ciherang-Sub1-AG1 | 2.34 | 1.85 | 6.63 | 2.64 | 2.88 | 4.03 | ||
| Ciherang-Sub1-AG2 | 1.70 | 2.73 | 5.11 | 3.53 | 4.05 | 3.28 | ||
| Ciherang-Sub1-AG1-AG2 | 1.93 | 4.27 | 7.46 | 4.89 | 6.30 | 6.56 | ||
| Ciherang-Sub1 | 1.02 | 1.20 | 2.69 | 0.87 | 1.70 | 1.94 | ||
| Ma-Zhan Red | 1.27 | 5.37 | 6.03 | 2.07 | 3.71 | 7.71 | ||
| Mean | 1.7 | 3.1 | 5.6 | 2.8 | 3.7 | 4.7 | ||
| LSD 0.05 | 1.14* | 1.14* | 1.14* | 1.14* | 1.14* | 1.14* | ||
| Genotype | Yield (t/hm2) | Straw yield (t/hm2) | ||
|---|---|---|---|---|
| Control | Flood | Control | Flood | |
| Wet season-2016 | ||||
| Ciherang-Sub1+AG1 | 2.8 | 1.8 | 7.48 | 5.82 |
| Ciherang-Sub1+AG2 | 3.48 | 2.49 | 5.86 | 6.49 |
| Ciherang-Sub1+AG1+AG2 | 3.77 | 3.4 | 5.38 | 7.2 |
| Ciherang-Sub1 | 3.1 | 1.36 | 5.8 | 4.72 |
| KHO | 3.01 | 2.42 | 8.34 | 9.59 |
| Ma-Zhan Red | 2.59 | 2.08 | 8.69 | 8.35 |
| Mean | 3.13 | 2.26 | 6.93 | 7.03 |
| HSD0.05 | 0.92* | 0.72** | 2.38* | 1.40** |
| Dry season-2017 | ||||
| PSB Rc82-AG1 | 6.26 | 4.51 | 7.16 | 6.89 |
| PSB Rc82-AG2 | 6.86 | 4.13 | 7.62 | 6.70 |
| PSB Rc82-AG1+AG2 | 6.67 | 4.59 | 7.13 | 5.69 |
| Ciherang-Sub1+AG1 | 5.95 | 3.81 | 10.99 | 5.37 |
| Ciherang-Sub1+AG2 | 5.19 | 4.29 | 9.51 | 7.17 |
| Ciherang-Sub1+AG1+AG2 | 6.04 | 4.65 | 10.58 | 7.66 |
| PSB Rc82 | 6.68 | 2.76 | 7.44 | 4.89 |
| Ciherang-Sub1 | 6.71 | 3.27 | 7.62 | 5.88 |
| KHO | 2.90 | 2.53 | 9.42 | 8.43 |
| Ma-Zhan Red | 3.72 | 3.50 | 8.68 | 8.65 |
| Mean | 5.70 | 3.92 | 8.61 | 6.71 |
| HSD0.05 | 0.78** | 0.94** | 2.23** | 1.92** |
Supplemental Table 5. Grain yield and straw yield of AG-lines under control and flooded conditions during wet season 2016 and dry season 2017.
| Genotype | Yield (t/hm2) | Straw yield (t/hm2) | ||
|---|---|---|---|---|
| Control | Flood | Control | Flood | |
| Wet season-2016 | ||||
| Ciherang-Sub1+AG1 | 2.8 | 1.8 | 7.48 | 5.82 |
| Ciherang-Sub1+AG2 | 3.48 | 2.49 | 5.86 | 6.49 |
| Ciherang-Sub1+AG1+AG2 | 3.77 | 3.4 | 5.38 | 7.2 |
| Ciherang-Sub1 | 3.1 | 1.36 | 5.8 | 4.72 |
| KHO | 3.01 | 2.42 | 8.34 | 9.59 |
| Ma-Zhan Red | 2.59 | 2.08 | 8.69 | 8.35 |
| Mean | 3.13 | 2.26 | 6.93 | 7.03 |
| HSD0.05 | 0.92* | 0.72** | 2.38* | 1.40** |
| Dry season-2017 | ||||
| PSB Rc82-AG1 | 6.26 | 4.51 | 7.16 | 6.89 |
| PSB Rc82-AG2 | 6.86 | 4.13 | 7.62 | 6.70 |
| PSB Rc82-AG1+AG2 | 6.67 | 4.59 | 7.13 | 5.69 |
| Ciherang-Sub1+AG1 | 5.95 | 3.81 | 10.99 | 5.37 |
| Ciherang-Sub1+AG2 | 5.19 | 4.29 | 9.51 | 7.17 |
| Ciherang-Sub1+AG1+AG2 | 6.04 | 4.65 | 10.58 | 7.66 |
| PSB Rc82 | 6.68 | 2.76 | 7.44 | 4.89 |
| Ciherang-Sub1 | 6.71 | 3.27 | 7.62 | 5.88 |
| KHO | 2.90 | 2.53 | 9.42 | 8.43 |
| Ma-Zhan Red | 3.72 | 3.50 | 8.68 | 8.65 |
| Mean | 5.70 | 3.92 | 8.61 | 6.71 |
| HSD0.05 | 0.78** | 0.94** | 2.23** | 1.92** |
| [1] | Abdul-baki A A, Anderson J D.1973. Vigor determination in soybean seed by multiple criteria. Crop Sci, 13(6): 630-633. |
| [2] | Adhikari B B, Mehera B, Haefele S.2013. Impact of rice nursery nutrient management, seeding density and seedling age on yield and yield attributes. Am J Plant Sci, 4: 146-155. |
| [3] | Awan T H, Cruz P C S, Chauhan B S.2015. Ecological significance of rice (Oryza sativa) planting density and nitrogen rates in managing the growth and competitive ability of itchgrass(Rottboellia cochinchinensis) in direct-seeded rice systems. J Pest Sci, 88: 427-438. |
| [4] | Begum M.2006. Biology and Management of Fimbristylis Miliacea (L.) Vahl.[PhD Thesis]. Malaysia: University Putra Malaysia. |
| [5] | Bhowmick M K, Dhara M C, Singh S, Dar M H, Singh U S.2014. Improved management options for submergence-tolerant (Sub1) rice genotype in flood-prone rainfed lowlands of West Bengal. Am J Plant Sci, 5(1): 14-23. |
| [6] | Chauhan B S.2012. Weed ecology and weed management strategies for dry-seeded rice in Asia. Weed Technol, 26(1): 1-13. |
| [7] | Chauhan B S, Awan T H, Abugho S B, Evengelista G, Sudhir-Yadav.2015. Effect of crop establishment methods and weed control treatments on weed management, and rice yield. Field Crops Res, 172: 72-84. |
| [8] | Chen H J, Wang S J.2008. Molecular regulation of sink-source transition in rice leaf sheaths during the heading period. Acta Physiol Plant, 30: 639-649. |
| [9] | Cock J H, Yoshida S.1972. Accumulation of 14C-labelled carbohydrate before flowering and its subsequent redistribution and respiration in the rice plant. Jpn J Crop Sci, 41: 226-234. |
| [10] | Conocono E A, Egdane J A, Setter T L.1998. Estimation of canopy photosynthesis in rice by means of daily increases in leaf carbohydrate concentrations. Crop Sci, 38: 987-995. |
| [11] | Drew M C.1997. Oxygen deficiency and root metabolism: Injury and acclimation under hypoxia and anoxia. Ann Rev Plant Physiol Plant Mol Biol, 48: 223-250. |
| [12] | Ella E S, Dionisio-Sese M L, Ismail A M. 2011. Seed pretreatment in rice reduces damage, enhances carbohydrate mobilization and improves emergence and seedling establishment under flooded conditions. AoB Plant, 2011: plr007. |
| [13] | Ella E S, Ismail A M.2006. Seedling nutrient status before submergence affects survival after submergence in rice. Crop Sci, 46: 1673-1681. |
| [14] | Estioko L P, Miro B, Baltazar A M, Merca F E, Ismail A M, Johnson D E.2014. Differences in responses to flooding by germinating seeds of two contrasting rice cultivars and two species of economically important grass weeds. AoB Plants, 6: plu064. |
| [15] | Fales F W.1951. The assimilation and degradation of carbohydrates by yeast cells. J Biol Chem 193(1): 113-124. |
| [16] | Fernández-pascual E, Pérez-arcoiza A, Prieto J A, Díaz T E.2017. Environmental filtering drives the shape and breadth of the seed germination niche in coastal plant communities. Ann Bot, 119(7): 1169-1177. |
| [17] | Furuhata M, Iwaka Y, Arima S.2006. Effects of the metabolites in the seeds and seedling emergence rate on the percentage of seedling emergence and establishment in rice direct-seeded under submerged conditions. Crop Sci, 75: 282-190. |
| [18] | Gibbs J, Morrell S, Valdez A, Setter T L, Greenway H.2000. Regulation of alcohol fermentation in coleoptiles of two rice cultivars differing in tolerance to anoxia. J Exp Bot, 51: 785-796. |
| [19] | Greenway H, Setter T L.1996. Is there anaerobic metabolism in submerged rice plants? A Review points. In: Singh V P, Singh R K, Singh B B, Zeigler R S. Physiology of Stress Tolerance in Rice. Faizabad, Manila, the Philippines: Narendra Deba University of Agriculture and Technology/International Rice Research Institute: 11-30. |
| [20] | Guglielminetti L, Yamaguchi J, Perata P, Alpi A.1995. Amylolytic activities in cereals seeds under aerobic and anaerobic conditions. Plant Physiol, 109(3): 1069-1076. |
| [21] | Grubb P J.1977. The maintenance of species-richness in plant communities: The importance of the regeneration niche. Biol Rev, 52(1): 107-145. |
| [22] | Ismail A M, Ella E S, Vergara G V, Mackill D J.2009. Mechanisms associated with tolerance to flooding during germination and early seedling growth in rice (Oryza sativa). Ann Bot, 103(2): 197-209. |
| [23] | Ismail A M, Johnson D E, Ella E S, Vergara G V, Baltazar A M.2012. Adaptation to flooding during emergence and seedling growth in rice and weeds, and implications for crop establishment. AoB Plants, 2012: pls019. |
| [24] | Ismail A M, Singh U S, Singh S, Dar M H, Mackill D J.2013. The contribution of submergence-tolerant (Sub1) rice varieties to food security in flood-prone areas. Field Crops Res, 152: 83-93. |
| [25] | Joshi T.2017. Responses of rice genotypes with contrasting tolerance to flooding during germination under different management options in rainfed lowlands. [PhD thesis]. Los Banos, the Philippines: University of the Philippines. |
| [26] | Kato-Noguchi H, Yasuda Y, Sasaki R.2010. Soluble sugar availability of aerobically germinated barley, oat and rice coleoptiles in anoxia. J Plant Physiol, 167(18): 1571-1576. |
| [27] | Kato Y, Collard B C Y, Septiningsih E M, Ismail A M.2014. Physiological analyses of traits associated with tolerance of long-term partial submergence in rice. AoB Plants, 6: plu058. |
| [28] | Khalifa Ali A A, Elkhoby W, Okasha E M.2014. Effect of sowing dates and seed rates on some rice cultivars. Afr J Agric Res, 9(2): 196-201. |
| [29] | Kretzschmar T, Pelayo M A F, Trijatmiko K R, Gabunada L F M, Alam R, Jimenez R, Mendioro M S, Slamet-Loedin I H, Sreenivasulu N, Bailey-Serres J, Ismail A M, Mackill D J, Septiningsih E M. 2015. A trehalose-6-phosphate phosphatase enhances anaerobic germination tolerance in rice. Nat Plants, 2015: 124. |
| [30] | Lal B, Gautama P, Nayaka A K, Rajaa R, Shahida M, Tripathi R, Singh S, Septiningsih E M, Ismail A M.2018. Agronomic manipulations can enhance the productivity of anaerobic tolerant rice sown in flooded soils in rainfed areas. Field Crops Res, 220: 105-116. |
| [31] | Lampayan R M, Faronilo J E, Tuong T P, Espiritu A J, de Dios J L, Bayot R S, Bueno C S, Hosen Y.2015. Effects of seedbed management and delayed transplanting of rice seedlings on crop performance, grain yield, and water productivity. Field Crops Res, 183: 303-314. |
| [32] | Lubis I, Ohnisi M, Katsura K, Shiraiwa T.2013. Plant factors related to dry matter production in rice cultivars. J ISSAAS, 19(2): 58-67. |
| [33] | Machado S, Bynum Jr E D, Archer T L, Lascano R J, Wilson L T, Bordovsky J, Segarra E, Bronson K, Nesmith D M, Xu W.2002. Spatial and temporal variability of corn growth and grain yield: Implications for site-specific farming. Crop Sci, 42: 1564-1576. |
| [34] | Matsumura H, Takano T, Takeda G, Uchimiya H.1998. Adh1 is transcriptionally active but its translational product is reduced in a rad mutant of rice (Oryza sativa L.), which is vulnerable to submergence stress. Theor Appl Genet, 97: 1197-1203. |
| [35] | Mishra A, Salokhe V M.2010. Flooding stress: The effects of planting pattern and water regime on root morphology, physiology and grain yield of rice. J Agron Crop Sci, 196(5): 368-378. |
| [36] | Mondal S.2018. Effect of AG1 and AG2 QTLs and combination of crop management on establishment, physiology, antioxidant properties, yield and grain quality of direct-seeded rice during anaerobic germination. [PhD Thesis]. Los Banos, the Philippines: University of the Philippines. |
| [37] | Mondal S, Khan M I R, Entila F, Dxit S, Cruz P C S, Ali M P, Pittendrigh B, Septiningsih E M, Ismail A M.2020a. ResponsesAG1 and AG2 QTL introgression lines and seed pre-treatment on growth and physiological processes during anaerobic germination of rice under flooding. Sci Rep, 10: 10214. |
| [38] | Mondal S, Khan M I R, Dixit S, Cruz P C S, Septiningsih E M, Ismail A M.2020b. Growth, productivity and grain quality of AG1 and AG2 QTLs introgression lines under flooding in direct- seeded rice system. Field Crops Res, 248: 1-12. |
| [39] | Murata T, Akazaw T, Fukuchi S.1968. Enzymic mechanism of starch breakdown in germinating rice seeds, an analytical study. Plant Physiol, 43: 1899-1905. |
| [40] | Pandey S, Velasco L.2002. Economics of direct seeding in Asia: patterns of adoption and research priorities. In: Pandey S, Mortimer M, Wade L, Tuong T, Lopez K, Hardy B. Direct seeding: Research Issues and Opportunities. Proceedings of the International Workshop on Direct Seeding in Asian Rice System: Strategic Research Issues and Opportunities, International Rice Research Institute Bangkok, Thailand/Los Baños, the Philippines: 3-14. |
| [41] | Ram P C, Singh B B, Singh A K, Ram P, Singh P N, Singh H P, Boamfa L, Harren F, Santosa E, Jackson M B, Setter T L, Reuss J, Wade L J, Singh V P, Singh R K.2002. Physiological basis of submergence tolerance in rainfed lowland rice: Prospects of germplasm improvement through marker aided breeding. Field Crops Res, 76: 131-152. |
| [42] | Ram P C, Mazid M A, Ismail A M, Singh P N, Singh V N, Haque M A, Singh U, Ella E S, Singh B B.2009. Crop and resource management in flood-prone areas: Farmers’ strategies and research development. In: Haefele S M, Ismail A M. Natural Resource Management for Poverty Reduction and Environmental Sustainability in Fragile Rice-Based Systems. Limited Proceedings No. 15. Los Banos, the Philippines: International Rice Research Institute: 82-94. |
| [43] | Saika H, Matsumura H, Takano T, Tsutsumi N, Nakazono M.2006. A point mutation of Adh1 gene is involved in the repression of coleoptiles elongation under submergence in rice. Breeding Sci, 56: 69-74. |
| [44] | Sarangi S K, Maji B, Singh S, Burman D, Mandal S, Sharma D K, Singh U S, Ismail A M, Haefele S M.2015. Improved nursery management further enhances the productivity of stress-tolerant rice varieties in coastal rainfed lowlands. Field Crops Res, 174: 61-70. |
| [45] | Septiningsih E M, Ignacio J C I, Sendon P M D, Sanchez D L, Ismail A M, Mackill D J.2013. QTL mapping and confirmation for tolerance of anaerobic conditions during germination derived from the rice landrace Ma-Zhan Red. Theor Appl Genet, 126: 1357-1366. |
| [46] | Shingaki-Wells R N, Huang S, Taylor N L, Carroll A J, Zhou W X, Millar A H.2011. Differential molecular responses of rice and wheat coleoptiles to anoxia reveal novel metabolic Adaptations in amino acid metabolism for tissue tolerance. Plant Physiol, 156(4): 1706-1724. |
| [47] | Shukla S, Felderhoff T J, Saballos A, Vermerris W.2017. The relationship between plant height and sugar accumulation in the stems of sweet sorghum (Sorghum bicolor(L.) Moench). Field Crops Res, 203: 181-191. |
| [48] | Singh A, Carandang J, Gonzaga Z J C, Collard B C Y, Ismail A M, Septiningsih E M.2017. Identification of QTLs for yield and agronomic traits in rice under stagnant flooding conditions. Rice, 10: 15. |
| [49] | Singh S, Mackill D J, Ismail A M.2014. Physiological bases of tolerance to complete submergence in rice involves other genetic factors in addition to SUB1. AoB Plants, 6: plu060. |
| [50] | Singh U M, Sudhir-Yadav, Dixit S, Ramayya P J, Devi M N, Raman K A, Kumar A.2017. QTL hotspots for early vigor and related traits under dry direct-seeded system in rice (Oryza sativa L.). Front Plant Sci, 8: 286. |
| [51] | Sudhir-Yadav, Evangelista G, Faronilo J, Humphreys E, Henry A, Fernandez L.2014. Establishment method effects on crop performance and water productivity of irrigated rice in the tropics. Field Crops Res, 166: 112-127. |
| [52] | Turner F T, Chen C C, Mccauley G N.1981. Morphological development of rice seedling in water at control oxygen levels. Agron J, 73(3): 566-570. |
| [53] | Wang W Q, Peng S B, Chen Q, Mei J H, Dong H L, Nie L X.2016. Effects of pre-sowing seed treatments on establishment of dry direct seeded early rice under chilling stress. AoB Plants, 8: plw074. |
| [54] | Xie X J, Shen S H, Li Y X, Zhao X Y, Li B B, Xu D F.2011. Effect of photosynthetic characteristic and dry matter accumulation of rice under high temperature at heading stage. Afr J Agric Res, 6(7): 1931-1940. |
| [1] | Zhu Jinling, Wei Ruping, Wang Xin, Zheng Chaoqun, Wang Mengmeng, Yang Yicheng, Yang Liuyan. Polyphosphate Accelerates Transformation of Nonstructural Carbohydrates to Improve Growth of ppk-Expressing Transgenic Rice in Phosphorus Deficiency Culture [J]. Rice Science, 2023, 30(3): 235-246. |
| [2] | Guangchen Zhang, Zimeng Liu, Youhong Liu, Noriyuki Kuya, Yuchen Hua, Hongru Shi, Weilin Zhao, Yuqing Han, Toshio Yamamoto, Wenfu Chen, Jian Sun. iTRAQ-Based Proteomics Investigation of Critical Response Proteins in Embryo and Coleoptile During Rice Anaerobic Germination [J]. Rice Science, 2021, 28(4): 391-401. |
| [3] | Panda Debabrata, Barik Jijnasa. Flooding Tolerance in Rice: Focus on Mechanisms and Approaches [J]. Rice Science, 2021, 28(1): 43-57. |
| [4] | Kanta Gaihre Yam, Singh Upendra, D. Bible Wendie, Fugice Jr Job, Sanabria Joaquin. Mitigating N2O and NO Emissions from Direct-Seeded Rice with Nitrification Inhibitor and Urea Deep Placement [J]. Rice Science, 2020, 27(5): 434-444. |
| [5] | Danying Wang, Chang Ye, Chunmei Xu, Zaiman Wang, Song Chen, Guang Chu, Xiufu Zhang. Soil Nitrogen Distribution and Plant Nitrogen Utilization in Direct-Seeded Rice in Response to Deep Placement of Basal Fertilizer-Nitrogen [J]. Rice Science, 2019, 26(6): 404-415. |
| [6] | R. Kuanar Sandhya, Ray Anuprita, K. Sethi Santosh, Chattopadhyay Krishnendu, K. Sarkar Ramani. Physiological Basis of Stagnant Flooding Tolerance in Rice [J]. Rice Science, 2017, 24(2): 73-84. |
| [7] | Ur Rehman Hafeez, Kamran Muhammad, Maqsood Ahmed Basra Shahzad, Afzal Irfan, Farooq Muhammad. Influence of Seed Priming on Performance and Water Productivity of Direct Seeded Rice in Alternating Wetting and Drying [J]. Rice Science, 2015, 22(4): 189-196. |
| [8] | R. K. NARESH, S. S. TOMAR, Dipender KUMAR, Samsher, Purushottam, S. P. SINGH, Ashish DWIVEDI, Vineet KUMARVineet KUMAR. Experiences with Rice Grown on Permanent Raised Beds: Effect of Crop Establishment Techniques on Water Use, Productivity, Profitability and Soil Physical Properties [J]. RICE SCIENCE, 2014, 21(3): 170-180. |
| [9] | Ramni Kumar SARKAR. Seed Priming Improves Agronomic Trait Performance under Flooding and Non-flooding Conditions in Rice with QTL SUB1 [J]. RICE SCIENCE, 2012, 19(4): 286-294. |
| [10] | DONG Chen-fei, CAI Qing-sheng, WANG Cai-lin, Jiro HARADA, Keisuke NEMOTO, SHEN Yi-xin. QTL Analysis for Traits Associated with Feeding Value of Straw in Rice (Oryza sativa L.) [J]. RICE SCIENCE, 2008, 15(3): 195-200 . |
| Viewed | ||||||
|
Full text |
|
|||||
|
Abstract |
|
|||||