Rice Science ›› 2017, Vol. 24 ›› Issue (5): 274-282.DOI: 10.1016/j.rsci.2017.06.001
• Orginal Article • Previous Articles Next Articles
Maziah Hanum Osman Nur1, Mohd-Yusof Barakatun-Nisak1,2( ), Ismail Amin1,2
Received:2016-10-30
Accepted:2017-06-15
Online:2017-09-15
Published:2017-08-31
Maziah Hanum Osman Nur, Mohd-Yusof Barakatun-Nisak, Ismail Amin. Estimating Glycemic Index of Rice-Based Mixed Meals by Using Predicted and Adjusted Formulae[J]. Rice Science, 2017, 24(5): 274-282.
Add to citation manager EndNote|Ris|BibTeX
| Food | Weight (g) | Energy (kcal) | Carbohydrate (g) | Fat (g) | Protein (g) | Fiber (g) | Rice to water ratio |
|---|---|---|---|---|---|---|---|
| Red rice | 84 | 114 | 25.00 (88.5) | 0.16 (0.6) | 3.08 (10.9) | 1.50 | 1:2 |
| Fragrant white rice | 77 | 110 | 25.00 (91.5) | 0.15 (0.6) | 2.16 (7.9) | 0.53 | 1:1 |
| Parboiled rice | 110 | 113 | 25.00 (89.0) | 0.22 (0.8) | 2.86 (10.2) | 0.10 | 1:1 |
| Fried red rice a | 135 | 247 | 25.20 (55.6) | 13.24 (29.2) | 6.90 (15.2) | 1.07 | - |
| Fried fragrant white rice a | 129 | 243 | 25.10 (56.5) | 13.20 (29.7) | 6.10 (13.8) | 0.32 | - |
| Fried parboiled rice a | 157 | 246 | 25.10 (55.8) | 13.20 (29.3) | 6.70 (14.9) | 0.09 | - |
| a Estimated using Nutritionist ProTM (First Data Bank Inc, Washington, USA). Values in the parentheses are the contributive percentage for energy. | |||||||
Table 1 Nutrient composition and rice to water ratio of test rice.
| Food | Weight (g) | Energy (kcal) | Carbohydrate (g) | Fat (g) | Protein (g) | Fiber (g) | Rice to water ratio |
|---|---|---|---|---|---|---|---|
| Red rice | 84 | 114 | 25.00 (88.5) | 0.16 (0.6) | 3.08 (10.9) | 1.50 | 1:2 |
| Fragrant white rice | 77 | 110 | 25.00 (91.5) | 0.15 (0.6) | 2.16 (7.9) | 0.53 | 1:1 |
| Parboiled rice | 110 | 113 | 25.00 (89.0) | 0.22 (0.8) | 2.86 (10.2) | 0.10 | 1:1 |
| Fried red rice a | 135 | 247 | 25.20 (55.6) | 13.24 (29.2) | 6.90 (15.2) | 1.07 | - |
| Fried fragrant white rice a | 129 | 243 | 25.10 (56.5) | 13.20 (29.7) | 6.10 (13.8) | 0.32 | - |
| Fried parboiled rice a | 157 | 246 | 25.10 (55.8) | 13.20 (29.3) | 6.70 (14.9) | 0.09 | - |
| a Estimated using Nutritionist ProTM (First Data Bank Inc, Washington, USA). Values in the parentheses are the contributive percentage for energy. | |||||||
| Participant ID | Glucose iAUC 1 (mmol∙min/L) | Glucose iAUC 2 (mmol∙min/L) | Glucose iAUC 3 (mmol∙min/L) | CV (%) |
|---|---|---|---|---|
| 1 | 117 | 127 | 144 | 10.55 |
| 2 | 141 | 222 | 162 | 24.02 |
| 3 | 270 | 205 | 168 | 24.09 |
| 4 | 176 | 218 | 167 | 14.55 |
| 5 | 268 | 260 | 324 | 12.27 |
| 6 | 215 | 137 | 208 | 23.11 |
| 7 | 117 | 177 a | 90 | 18.44 |
| 8 | 171 | 114 | 117 | 23.93 |
| 9 | 214 | 210 | 170 | 12.28 |
| 10 | 179 | 272 | 183 | 24.87 |
| 11 | 132 | 234 | 187 | 27.69 |
| Average CV b | 22.23 (20.23) | |||
| a The value is excluded to obtain individual of CV < 30%. b The value in the parenthesis is the average CV after removing one outlying result in one participant. Glucose iAUC 1, 2 and 3 refer to the three repeated test of glucose (Glucolin®, the Boots Company, Nottingham, United Kingdom). | ||||
Table 2 Coefficient variation (CV) calculation for iAUC of three repeated test of glucose for each participant.
| Participant ID | Glucose iAUC 1 (mmol∙min/L) | Glucose iAUC 2 (mmol∙min/L) | Glucose iAUC 3 (mmol∙min/L) | CV (%) |
|---|---|---|---|---|
| 1 | 117 | 127 | 144 | 10.55 |
| 2 | 141 | 222 | 162 | 24.02 |
| 3 | 270 | 205 | 168 | 24.09 |
| 4 | 176 | 218 | 167 | 14.55 |
| 5 | 268 | 260 | 324 | 12.27 |
| 6 | 215 | 137 | 208 | 23.11 |
| 7 | 117 | 177 a | 90 | 18.44 |
| 8 | 171 | 114 | 117 | 23.93 |
| 9 | 214 | 210 | 170 | 12.28 |
| 10 | 179 | 272 | 183 | 24.87 |
| 11 | 132 | 234 | 187 | 27.69 |
| Average CV b | 22.23 (20.23) | |||
| a The value is excluded to obtain individual of CV < 30%. b The value in the parenthesis is the average CV after removing one outlying result in one participant. Glucose iAUC 1, 2 and 3 refer to the three repeated test of glucose (Glucolin®, the Boots Company, Nottingham, United Kingdom). | ||||
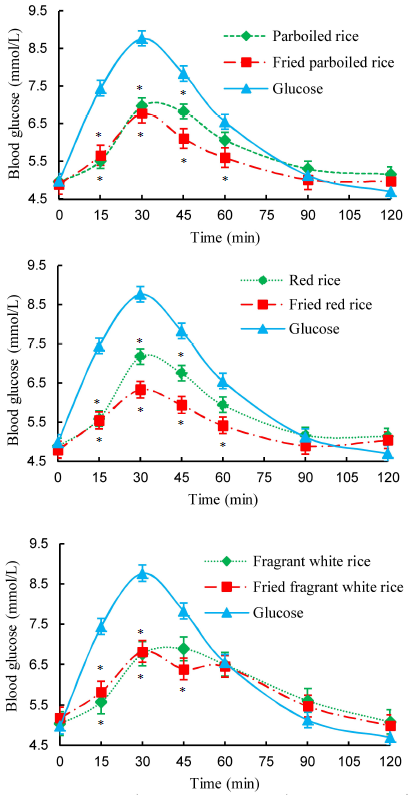
Fig. 1. Glycemic response of rice alone and mixed meals for red rice, fragrant rice and parboiled rice (Mean ± SD, n = 11). ^* indicates significant difference between rice and glucose (P < 0.05).
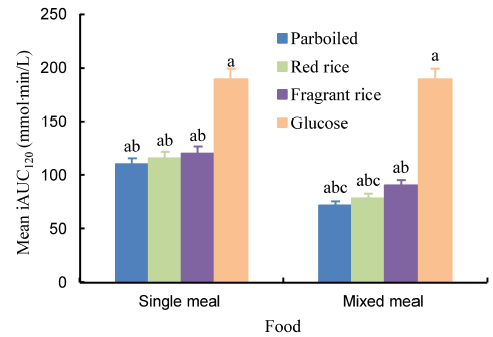
Fig. 2. iAUC120 comparison between rice alone and mixed meals. ^Values are mean ± SD (n = 11). ^Different letters above the bars mean significant difference at the 0.05 level.
| Test material | Protein (g) | Fat (g) | GIpred a | Proteinadj b | Fatadj c | GIadj d | ||||
| Red rice | 3.60 | 0.20 | - | 1.00 | 1.00 | |||||
| Fried red rice | 6.90 | 13.20 | 62 | 0.95 | 0.96 | 57 | ||||
| Fragrant white rice | 2.16 | 0.15 | - | 1.00 | 1.00 | |||||
| Fried fragrant white rice | 6.10 | 13.20 | 61 | 0.94 | 0.96 | 55 | ||||
| Parboiled rice | 2.86 | 0.22 | - | 1.00 | 1.00 | |||||
| Fried parboiled | 6.70 | 13.20 | 56 | 0.94 | 0.96 | 51 | ||||
| a Predicted meal GI as described by | ||||||||||
Table 3 Adjustment of calculated meal glycemic index (GI) for differences in fat, protein and carbohydrate content in mixed meals.
| Test material | Protein (g) | Fat (g) | GIpred a | Proteinadj b | Fatadj c | GIadj d | ||||
| Red rice | 3.60 | 0.20 | - | 1.00 | 1.00 | |||||
| Fried red rice | 6.90 | 13.20 | 62 | 0.95 | 0.96 | 57 | ||||
| Fragrant white rice | 2.16 | 0.15 | - | 1.00 | 1.00 | |||||
| Fried fragrant white rice | 6.10 | 13.20 | 61 | 0.94 | 0.96 | 55 | ||||
| Parboiled rice | 2.86 | 0.22 | - | 1.00 | 1.00 | |||||
| Fried parboiled | 6.70 | 13.20 | 56 | 0.94 | 0.96 | 51 | ||||
| a Predicted meal GI as described by | ||||||||||
| Test material | Fasting blood glucose (mmol/L) | Peak blood glucose value (mmol/L) | GIpred a | GIadj a | GImeasured | |||||
| Glucose | 5.00 ± 0.21 | 8.86 ± 0.14 | 100 | 100 | 100 ± 0 | |||||
| Red rice | 4.88 ± 0.13 | 7.08 ± 0.32 | - | - | 68 ± 8 | |||||
| Fried red rice | 4.83 ± 0.09 | 6.36 ± 0.25 | 62 | 57 | 41 ± 4 | |||||
| Fragrant white rice | 5.05 ± 0.09 | 6.95 ± 0.19 | - | - | 67 ± 7 | |||||
| Fried fragrant white rice | 5.22 ± 0.19 | 6.86 ± 0.20 | 61 | 55 | 50 ± 7 | |||||
| Parboiled rice | 4.96 ± 0.12 | 6.87 ± 0.23 | - | - | 61 ± 8 | |||||
| Fried parboiled rice | 4.91 ± 0.10 | 6.68 ± 0.25 | 56 | 51 | 41 ± 4 | |||||
| a GIpred and GIadj values were calculated via equations from | ||||||||||
Table 4 Fasting blood glucose values, peak blood glucose values, estimated glycemic index (GI) and measured GI (Mean ± SE, n = 11).
| Test material | Fasting blood glucose (mmol/L) | Peak blood glucose value (mmol/L) | GIpred a | GIadj a | GImeasured | |||||
| Glucose | 5.00 ± 0.21 | 8.86 ± 0.14 | 100 | 100 | 100 ± 0 | |||||
| Red rice | 4.88 ± 0.13 | 7.08 ± 0.32 | - | - | 68 ± 8 | |||||
| Fried red rice | 4.83 ± 0.09 | 6.36 ± 0.25 | 62 | 57 | 41 ± 4 | |||||
| Fragrant white rice | 5.05 ± 0.09 | 6.95 ± 0.19 | - | - | 67 ± 7 | |||||
| Fried fragrant white rice | 5.22 ± 0.19 | 6.86 ± 0.20 | 61 | 55 | 50 ± 7 | |||||
| Parboiled rice | 4.96 ± 0.12 | 6.87 ± 0.23 | - | - | 61 ± 8 | |||||
| Fried parboiled rice | 4.91 ± 0.10 | 6.68 ± 0.25 | 56 | 51 | 41 ± 4 | |||||
| a GIpred and GIadj values were calculated via equations from | ||||||||||
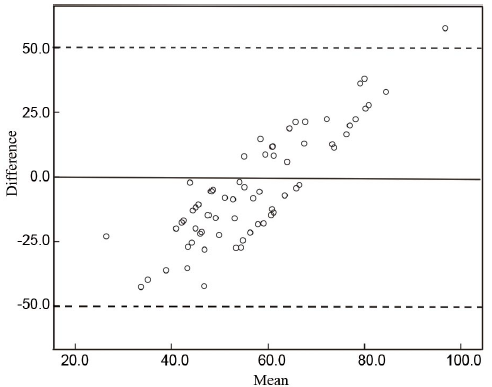
Fig. 3. Limit of agreement between GImeasured and GIadj.^Difference in GImeasured and GIadj was calculated by substracting GImeasured from GIadj. Mean of GImeasured and GIadj was calculated by averaging GImeasured and GIadj. The dotted line represents the limit of agreement between GImeasured and GIadj. Middle line represents a mean difference between GImeasured and GIadj.
| Test rice | Other studies a | This study | ||
|---|---|---|---|---|
| Number | Range | Mean ± SE | ||
| Red rice | 2 | 76-99 | 68 ± 8 | |
| Fragrant white rice | 4 | 79-84 | 67 ± 7 | |
| Parboiled rice | 19 | 38-87 | 61 ± 8 | |
| a Data obtained from | ||||
Table 5 Glycemic index values of three different types of rice from various studies and in this study.
| Test rice | Other studies a | This study | ||
|---|---|---|---|---|
| Number | Range | Mean ± SE | ||
| Red rice | 2 | 76-99 | 68 ± 8 | |
| Fragrant white rice | 4 | 79-84 | 67 ± 7 | |
| Parboiled rice | 19 | 38-87 | 61 ± 8 | |
| a Data obtained from | ||||
| [1] | Abdul Karim N, Mohd Yusof S, Hashim J K, Din M, Haslinda S, Harun Z, Saleh Hudin R, Salim F, Ngadikin M, Norazlin S.2008. Food consumption patterns: Findings from the Malaysian adult nutrition survey (MANS).Mal J Nutr, 14(1): 25-39. |
| [2] | Ajala O, English P, Pinkney J.2013. Systematic review and meta-analysis of different dietary approaches to the management of Type 2 diabetes.Am J Clin Nutr, 97(3): 505-516. |
| [3] | Asp N G.2001. Enzymatic gravimetric methods. In: Spiller G A. CRC Handbook of Dietary Fiber in Human Nutrition. 3rd edn. Boca Raton, London, New York, Washington D C: CRC Press. |
| [4] | Association of Official Analytical Chemists (AOAC). 1998. Official Methods of Analysis of the AOAC International. 16th edn. Gaithersburg, MD, USA: AOAC International. |
| [5] | Atkinson F S, Foster-Powell K, Brand-Miller J C.2008. International tables of glycemic index and glycemic load values: 2008.Diab Care, 31(12): 2281-2283. |
| [6] | Australian Standard.2007. Glycemic Index of Food. Sydney: Standards Australia. |
| [7] | Behall K M, Scholfield D J.2005. Food amylose content affects postprandial glucose and insulin responses.Cereal Chem, 82(6): 654-659. |
| [8] | Bhupathiraju S N, Tobias D K, Malik V S, Pan A, Hruby A, Manson J E, Willett W C, Hu F B.2014. Glycemic index, glycemic load, and risk of Type 2 diabetes: Results from 3 large US cohorts and an updated meta-analysis.Am J Clin Nutr, 100: 218-232. |
| [9] | Chen L, Pei J H, Kuang J, Chen H M, Chen Z, Li Z W, Yang H Z.2015. Effect of lifestyle intervention in patients with Type 2 diabetes: A meta-analysis.Metabolism, 64(2): 338-347. |
| [10] | Cohen J.1977. Statistical Power Analysis for the Behavioral Sciences. New York, USA: Lawrence Erlbaum Associates. |
| [11] | Dodd H, Williams S, Brown R, Venn B.2011. Calculating meal glycemic index by using measured and published food values compared with directly measured meal glycemic index.Am J Clin Nutr, 94(4): 992-996. |
| [12] | Flint A, Møller B K, Raben A, Pedersen D, Tetens I, Holst J J, Astrup A.2004. The use of glycaemic index tables to predict glycaemic index of composite breakfast meals.Brit J Nutr, 91(6): 979-989. |
| [13] | Foster-Powell K, Holt S H, Brand-Miller J C.2002. International table of glycemic index and glycemic load values: 2002.Am J Clin Nutr, 76(1): 5-56. |
| [14] | Giavarina D.2015. Understanding bland altman analysis.Biochem Med, 25(2): 141-151. |
| [15] | Hatonen K A, Virtamo J, Eriksson J G, Sinkko H K, Sundvall J E, Valsta L M.2011. Protein and fat modify the glycaemic and insulinemic responses to a mashed potato-based meal.Brit J Nutr, 106(2): 248-253. |
| [16] | Hu E A, Pan A, Malik V, Sun Q.2012. White rice consumption and risk of Type 2 diabetes: Meta-analysis and systematic review.Brit Med J, 344: e1454. |
| [17] | International Organization Standard.2010. ISO26642-2010: Food Products: Determination of the Glycaemic Index (GI) and Recommendation for Food Classification. Switzerland: International Organization for Standardization. |
| [18] | Kaur B, Ranawana V, Henry J.2016. The glycaemic index of rice and rice products: A review, and table of GI values.Crit Rev Food Sci Nutr, 56(2): 215-236. |
| [19] | Loh B I, Sathyasurya D R, Jan Mohamed H J.2013. Plasma adiponectin concentrations are associated with dietary glycemic index in Malaysian patients with Type 2 diabetes.Asia Pac J Clin Nutr, 22(2): 241-248. |
| [20] | Miller J B, Pang E, Bramall L.1992. Rice: A high or low glycemic index food?Am J Clin Nutr, 56(6): 1034-1036. |
| [21] | Nisak M Y B, Abd Talib R, Norimah A K, Gilbertson H, Azmi K N.2010. Improvement of dietary quality with the aid of a low glycemic index diet in Asian patients with Type 2 diabetes mellitus.J Am Coll Nutr, 29(3): 161-170. |
| [22] | Prosky L, Asp N G, Furda I, de Vries J W, Schweizer T F, Harland B F.1985. Determination of total dietary fiber in foods and food products: Collaborative study.J Assoc Anal Chem, 68(4): 677-679. |
| [23] | Robert S D, Ismail A A S.2012. Glycemic responses of patients with Type 2 diabetes to individual carbohydrate-rich foods and mixed meals.Ann Nutr Metab, 60(1): 27-32. |
| [24] | Ryan A T, Luscombe-Marsh N D, Saies A A, Little T J, Standfield S, Horowitz M, Feinle-Bisset C.2013. Effects of intraduodenal lipid and protein on gut motility and hormone release, glycemia, appetite, and energy intake in lean men.Am J Clin Nutr, 98(2): 300-311. |
| [25] | Shyam S, Arshad F, Abdul Ghani R, Wahab N A, Safii N S, Barakatun Nisak M Y, Chinna K, Kamaruddin N A.2013. Low glycaemic index diets improve glucose tolerance and body weight in women with previous history of gestational diabetes: A six months randomized trial.Nutr J, 12(1): 68. |
| [26] | Singh J, Dartois A, Kaur L.2010. Starch digestibility in food matrix: A review.Trends Food Sci Technol, 21(4): 168-180. |
| [27] | Sun L J, Ranawana D V, Leow M K S, Henry C J.2014. Effect of chicken, fat, and vegetable on glycaemia and insulinaemia to a white rice-based meal in healthy adults.Eur J Nutr, 53(8): 1719-1726. |
| [28] | Sun Q, Spiegelman D, van Dam R M, Holmes M D, Malik V S, Willett W C, Hu F B.2010. White rice, brown rice, and risk of Type 2 diabetes in US men and women.Arch Int Med, 170(11): 961-969. |
| [29] | Syahariza Z A, Sar S, Hasjim J, Tizzotti M J, Gilbert R G.2013. The importance of amylose and amylopectin fine structures for starch digestibility in cooked rice grains.Food Chem, 136(2): 742-749. |
| [30] | Sydney University Glycemic Index Research Service.2014. Datafiles of Sydney University Glycemic Index Database. Australia: The University ofSydney. |
| [31] | Wolever T M, Yang M, Zeng X Y, Atkinson F, Brand-Miller J C.2006. Food glycemic index, as given in glycemic index tables, is a significant determinant of glycemic responses elicited by composite breakfast meals.Am J Clin Nutr, 83(6): 1306-1312. |
| [32] | Wolever T M S.2013. Is glycaemic index (GI) a valid measure of carbohydrate quality?Eur J Clin Nutr, 67(5): 522-531. |
| [33] | Yusof B N M, Talib R A, Karim N A.2005. Glycaemic index of eight types of commercial rice in Malaysia.Malay J Nutr, 11(2): 151-163. |
| [1] | Prathap V, Suresh KUMAR, Nand Lal MEENA, Chirag MAHESHWARI, Monika DALAL, Aruna TYAGI. Phosphorus Starvation Tolerance in Rice Through a Combined Physiological, Biochemical and Proteome Analysis [J]. Rice Science, 2023, 30(6): 8-. |
| [2] | Serena REGGI, Elisabetta ONELLI, Alessandra MOSCATELLI, Nadia STROPPA, Matteo Dell’ANNO, Kiril PERFANOV, Luciana ROSSI. Seed-Specific Expression of Apolipoprotein A-IMilano Dimer in Rice Engineered Lines [J]. Rice Science, 2023, 30(6): 6-. |
| [3] | Sundus ZAFAR, XU Jianlong. Recent Advances to Enhance Nutritional Quality of Rice [J]. Rice Science, 2023, 30(6): 4-. |
| [4] | Kankunlanach KHAMPUANG, Nanthana CHAIWONG, Atilla YAZICI, Baris DEMIRER, Ismail CAKMAK, Chanakan PROM-U-THAI. Effect of Sulfur Fertilization on Productivity and Grain Zinc Yield of Rice Grown under Low and Adequate Soil Zinc Applications [J]. Rice Science, 2023, 30(6): 9-. |
| [5] | FAN Fengfeng, CAI Meng, LUO Xiong, LIU Manman, YUAN Huanran, CHENG Mingxing, Ayaz AHMAD, LI Nengwu, LI Shaoqing. Novel QTLs from Wild Rice Oryza longistaminata Confer Rice Strong Tolerance to High Temperature at Seedling Stage [J]. Rice Science, 2023, 30(6): 14-. |
| [6] | LIN Shaodan, YAO Yue, LI Jiayi, LI Xiaobin, MA Jie, WENG Haiyong, CHENG Zuxin, YE Dapeng. Application of UAV-Based Imaging and Deep Learning in Assessment of Rice Blast Resistance [J]. Rice Science, 2023, 30(6): 10-. |
| [7] | Md. Forshed DEWAN, Md. AHIDUZZAMAN, Md. Nahidul ISLAM, Habibul Bari SHOZIB. Potential Benefits of Bioactive Compounds of Traditional Rice Grown in South and South-East Asia: A Review [J]. Rice Science, 2023, 30(6): 5-. |
| [8] | Raja CHAKRABORTY, Pratap KALITA, Saikat SEN. Phenolic Profile, Antioxidant, Antihyperlipidemic and Cardiac Risk Preventive Effect of Chakhao Poireiton (A Pigmented Black Rice) in High-Fat High-Sugar induced Rats [J]. Rice Science, 2023, 30(6): 11-. |
| [9] | LI Qianlong, FENG Qi, WANG Heqin, KANG Yunhai, ZHANG Conghe, DU Ming, ZHANG Yunhu, WANG Hui, CHEN Jinjie, HAN Bin, FANG Yu, WANG Ahong. Genome-Wide Dissection of Quan 9311A Breeding Process and Application Advantages [J]. Rice Science, 2023, 30(6): 7-. |
| [10] | JI Dongling, XIAO Wenhui, SUN Zhiwei, LIU Lijun, GU Junfei, ZHANG Hao, Tom Matthew HARRISON, LIU Ke, WANG Zhiqin, WANG Weilu, YANG Jianchang. Translocation and Distribution of Carbon-Nitrogen in Relation to Rice Yield and Grain Quality as Affected by High Temperature at Early Panicle Initiation Stage [J]. Rice Science, 2023, 30(6): 12-. |
| [11] | Nazaratul Ashifa Abdullah Salim, Norlida Mat Daud, Julieta Griboff, Abdul Rahim Harun. Elemental Assessments in Paddy Soil for Geographical Traceability of Rice from Peninsular Malaysia [J]. Rice Science, 2023, 30(5): 486-498. |
| [12] | Monica Ruffini Castiglione, Stefania Bottega, Carlo Sorce, Carmelina SpanÒ. Effects of Zinc Oxide Particles with Different Sizes on Root Development in Oryza sativa [J]. Rice Science, 2023, 30(5): 449-458. |
| [13] | Tan Jingyi, Zhang Xiaobo, Shang Huihui, Li Panpan, Wang Zhonghao, Liao Xinwei, Xu Xia, Yang Shihua, Gong Junyi, Wu Jianli. ORYZA SATIVA SPOTTED-LEAF 41 (OsSPL41) Negatively Regulates Plant Immunity in Rice [J]. Rice Science, 2023, 30(5): 426-436. |
| [14] | Ammara Latif, Sun Ying, Pu Cuixia, Noman Ali. Rice Curled Its Leaves Either Adaxially or Abaxially to Combat Drought Stress [J]. Rice Science, 2023, 30(5): 405-416. |
| [15] | Liu Qiao, Qiu Linlin, Hua Yangguang, Li Jing, Pang Bo, Zhai Yufeng, Wang Dekai. LHD3 Encoding a J-Domain Protein Controls Heading Date in Rice [J]. Rice Science, 2023, 30(5): 437-448. |
| Viewed | ||||||
|
Full text |
|
|||||
|
Abstract |
|
|||||