Rice Science ›› 2018, Vol. 25 ›› Issue (3): 142-151.DOI: 10.1016/j.rsci.2018.04.002
• Orginal Article • Previous Articles Next Articles
Kazemi Sheidollah, Reza Eshghizadeh Hamid( ), Zahedi Morteza
Received:2017-12-22
Accepted:2018-01-24
Online:2018-05-04
Published:2018-03-07
Kazemi Sheidollah, Reza Eshghizadeh Hamid, Zahedi Morteza. Responses of Four Rice Varieties to Elevated CO2 and Different Salinity Levels[J]. Rice Science, 2018, 25(3): 142-151.
Add to citation manager EndNote|Ris|BibTeX
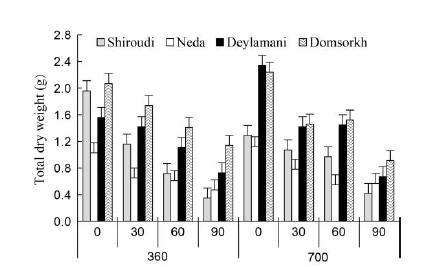
Fig. 1. Total dry weight of four rice varieties response to CO2 concentrations (0, 30, 60 and 90 mmol/L) and salinity levels (360 and 700 µmol/mol).
| df | Mean of square | |||||
|---|---|---|---|---|---|---|
| Plant leaf area | SPAD value | MDA concentration | WSC content | Total dry weight | ||
| CO2 )C) | 1 | 1 852.0** | 26.0** | 0.160** | 2 827** | 0.07 |
| Error a | 4 | 17 | 4.4** | 0.001 | 368** | 0.02 |
| Variety (V) | 3 | 1 850.0** | 174.0** | 0.540** | 732** | 4.40** |
| Salinity (S) | 3 | 1 3924.0** | 185.0** | 0.270** | 8 830** | 5.90** |
| V × S | 9 | 127.0** | 6.4** | 0.011** | 1 668** | 0.16** |
| C × V | 3 | 358.0** | 0.3 | 0.001 | 517** | 0.24** |
| C × S | 3 | 571.0** | 30.0** | 0.020** | 34 | 0.08 |
| C × S × V | 9 | 173.0** | 4.0** | 0.020** | 329** | 0.23** |
| Error b | 60 | 12.8 | 1.6 | 0.001 | 104 | 0.04 |
| CV | 8.1 | 3.2 | 7.5 | 5.7 | 18.6 | |
Table 1 Analysis of variance for traits in four rice genotypes at different salinity levels under contrasting ambient and elevated atmospheric CO2 concentration at 42 d after sowing.
| df | Mean of square | |||||
|---|---|---|---|---|---|---|
| Plant leaf area | SPAD value | MDA concentration | WSC content | Total dry weight | ||
| CO2 )C) | 1 | 1 852.0** | 26.0** | 0.160** | 2 827** | 0.07 |
| Error a | 4 | 17 | 4.4** | 0.001 | 368** | 0.02 |
| Variety (V) | 3 | 1 850.0** | 174.0** | 0.540** | 732** | 4.40** |
| Salinity (S) | 3 | 1 3924.0** | 185.0** | 0.270** | 8 830** | 5.90** |
| V × S | 9 | 127.0** | 6.4** | 0.011** | 1 668** | 0.16** |
| C × V | 3 | 358.0** | 0.3 | 0.001 | 517** | 0.24** |
| C × S | 3 | 571.0** | 30.0** | 0.020** | 34 | 0.08 |
| C × S × V | 9 | 173.0** | 4.0** | 0.020** | 329** | 0.23** |
| Error b | 60 | 12.8 | 1.6 | 0.001 | 104 | 0.04 |
| CV | 8.1 | 3.2 | 7.5 | 5.7 | 18.6 | |
| Variety | Salinity (mmol/L) | Plant leaf area (cm2) | SPAD value | MDA concentration (μmol/g) | WSC content (mg/mL) | ||||||||
|---|---|---|---|---|---|---|---|---|---|---|---|---|---|
| A | B | Mean | A | B | Mean | A | B | Mean | A | B | Mean | ||
| Shiroudi | 0 | 80 | 70 | 75 | 38 | 37 | 38 | 0.29 | 0.33 | 0.31 | 189 | 193 | 191 |
| 30 | 59 | 43 | 51 | 37 | 39 | 38 | 0.34 | 0.41 | 0.38 | 195 | 230 | 213 | |
| 60 | 31 | 34 | 33 | 34 | 38 | 36 | 0.38 | 0.53 | 0.46 | 163 | 200 | 181 | |
| 90 | 11 | 21 | 16 | 32 | 33 | 33 | 0.47 | 0.55 | 0.51 | 134 | 155 | 144 | |
| Neda | 0 | 61 | 69 | 65 | 41 | 39 | 40 | 0.26 | 0.34 | 0.3 | 201 | 227 | 214 |
| 30 | 49 | 36 | 43 | 39 | 38 | 39 | 0.28 | 0.4 | 0.34 | 191 | 196 | 194 | |
| 60 | 39 | 19 | 29 | 34 | 38 | 36 | 0.45 | 0.56 | 0.51 | 160 | 151 | 156 | |
| 90 | 15 | 18 | 17 | 34 | 37 | 36 | 0.59 | 0.54 | 0.57 | 138 | 136 | 137 | |
| Deylamani | 0 | 56 | 69 | 63 | 43 | 43 | 43 | 0.64 | 0.39 | 0.52 | 178 | 192 | 185 |
| 30 | 51 | 34 | 43 | 42 | 40 | 41 | 0.69 | 0.82 | 0.76 | 182 | 197 | 190 | |
| 60 | 38 | 31 | 35 | 36 | 39 | 38 | 0.72 | 0.92 | 0.67 | 187 | 201 | 194 | |
| 90 | 24 | 18 | 21 | 35 | 37 | 36 | 0.7 | 0.95 | 0.83 | 166 | 165 | 166 | |
| Domsorkh | 0 | 87 | 70 | 79 | 44 | 43 | 44 | 0.44 | 0.54 | 0.49 | 179 | 170 | 175 |
| 30 | 80 | 50 | 65 | 42 | 42 | 42 | 0.5 | 0.58 | 0.54 | 176 | 172 | 174 | |
| 60 | 51 | 39 | 45 | 41 | 42 | 42 | 0.61 | 0.7 | 0.66 | 177 | 188 | 182 | |
| 90 | 38 | 27 | 33 | 37 | 40 | 39 | 0.61 | 0.73 | 0.67 | 149 | 166 | 157 | |
| Mean | 48 a | 40 b | 38 a | 39 a | 0.48 b | 0.58 a | 172 a | 183 b | |||||
| LSD0.05 (C × S × V) | 5.8 | 2 | 0.05 | 17.5 | |||||||||
| LSD0.05 (S × V) | 3.9 | 1.3 | 0.04 | 12.4 | |||||||||
Table 2 Comparisons of plant leaf area and SPAD value, MDA and WSC concentrations under interaction effect of CO2 concentration, rice varieties and salinity treatments.
| Variety | Salinity (mmol/L) | Plant leaf area (cm2) | SPAD value | MDA concentration (μmol/g) | WSC content (mg/mL) | ||||||||
|---|---|---|---|---|---|---|---|---|---|---|---|---|---|
| A | B | Mean | A | B | Mean | A | B | Mean | A | B | Mean | ||
| Shiroudi | 0 | 80 | 70 | 75 | 38 | 37 | 38 | 0.29 | 0.33 | 0.31 | 189 | 193 | 191 |
| 30 | 59 | 43 | 51 | 37 | 39 | 38 | 0.34 | 0.41 | 0.38 | 195 | 230 | 213 | |
| 60 | 31 | 34 | 33 | 34 | 38 | 36 | 0.38 | 0.53 | 0.46 | 163 | 200 | 181 | |
| 90 | 11 | 21 | 16 | 32 | 33 | 33 | 0.47 | 0.55 | 0.51 | 134 | 155 | 144 | |
| Neda | 0 | 61 | 69 | 65 | 41 | 39 | 40 | 0.26 | 0.34 | 0.3 | 201 | 227 | 214 |
| 30 | 49 | 36 | 43 | 39 | 38 | 39 | 0.28 | 0.4 | 0.34 | 191 | 196 | 194 | |
| 60 | 39 | 19 | 29 | 34 | 38 | 36 | 0.45 | 0.56 | 0.51 | 160 | 151 | 156 | |
| 90 | 15 | 18 | 17 | 34 | 37 | 36 | 0.59 | 0.54 | 0.57 | 138 | 136 | 137 | |
| Deylamani | 0 | 56 | 69 | 63 | 43 | 43 | 43 | 0.64 | 0.39 | 0.52 | 178 | 192 | 185 |
| 30 | 51 | 34 | 43 | 42 | 40 | 41 | 0.69 | 0.82 | 0.76 | 182 | 197 | 190 | |
| 60 | 38 | 31 | 35 | 36 | 39 | 38 | 0.72 | 0.92 | 0.67 | 187 | 201 | 194 | |
| 90 | 24 | 18 | 21 | 35 | 37 | 36 | 0.7 | 0.95 | 0.83 | 166 | 165 | 166 | |
| Domsorkh | 0 | 87 | 70 | 79 | 44 | 43 | 44 | 0.44 | 0.54 | 0.49 | 179 | 170 | 175 |
| 30 | 80 | 50 | 65 | 42 | 42 | 42 | 0.5 | 0.58 | 0.54 | 176 | 172 | 174 | |
| 60 | 51 | 39 | 45 | 41 | 42 | 42 | 0.61 | 0.7 | 0.66 | 177 | 188 | 182 | |
| 90 | 38 | 27 | 33 | 37 | 40 | 39 | 0.61 | 0.73 | 0.67 | 149 | 166 | 157 | |
| Mean | 48 a | 40 b | 38 a | 39 a | 0.48 b | 0.58 a | 172 a | 183 b | |||||
| LSD0.05 (C × S × V) | 5.8 | 2 | 0.05 | 17.5 | |||||||||
| LSD0.05 (S × V) | 3.9 | 1.3 | 0.04 | 12.4 | |||||||||
| Trait | CO2 concentration (µmol/mol) | |
|---|---|---|
| 360 | 720 | |
| SPAD value | 0.70** | 0.71** |
| PLA | 0.78** | 0.72** |
| MDA concentration | 0.03 | -0.09 |
| WSC content | 0.41** | 0.26 |
Table 3 Correlation coefficients among the indices.
| Trait | CO2 concentration (µmol/mol) | |
|---|---|---|
| 360 | 720 | |
| SPAD value | 0.70** | 0.71** |
| PLA | 0.78** | 0.72** |
| MDA concentration | 0.03 | -0.09 |
| WSC content | 0.41** | 0.26 |
| [1] | Ali S, Zeng F, Cai S, Qiu B, Zhang G.2011. The interaction of salinity and chromium in the influence of barley growth and oxidative stress.Plant Soil Environ, 57(4): 153-159. |
| [2] | Ali Y, Aslam Z, Awan A R, Hussain F, Cheema A A.2004. Screening rice (Oryza sativa L.) lines/cultivars against salinity in relation to morphological and physiological traits and yield components. Int J Agric Biol, 6(3): 572-575. |
| [3] | Anonymous.2013. Statistics of Agriculture, Department of Economic Planning, Office of Statistics and Information Technology. Tehran. Iran: Ministry of Agriculture of the Islamic Republic of Iran: 132. |
| [4] | Asch F, Dingkuhn M, Doerffling K.2000. Salinity increases CO2 assimilation but reduces growth in field-grown irrigated rice.Plant Soil, 218: 1. |
| [5] | Azizi G, Rezvani Moghaddam P, Sharifi Nori M S.2008. The effect of salinity on some physiological characteristics and yield components of three species of millet (Pennisetum glaucum, Setaria italiaca and Panicum miliaceum) under greenhouse conditions. Iran J Agric Sci, 38: 79-85. |
| [6] | Baker J T.2004. Yield responses of southern US rice cultivars to CO2 and temperature.Agric For Meteorol, 122: 129-137. |
| [7] | Bayuelo-Jimenez J S, Debouk D G, Lynch J P.2002. Salinity tolerance in phaseolus species during early vegetative growth.Crop Sci, 42(6): 2184-2192. |
| [8] | Bernstein L, Bosch P, Canziani O, Chen Z, Christ R, Davidson O, Hare W, Huq S, Karoly D, Kattsov V, Kundzewicz Z, Liu J, Lohmann U, Manning M, Matsuno T, Menne B, Metz B, Mirza M, Nicholls N, Nurse L, Pachauri R, Palutikof J, Parry M, Qin D, Ravindranath N, Reisinger A, Ren J, Riahi K, Rosenzweig C, Rusticucci M, Schneider S, Sokona Y, Solomon S, Stott P, Stouffer R, Sugiyama T, Swart R, Tirpak D, Vogel C, Yohe G.2007. Climate Change 2007: Synthesis Report. Contribution of Working Groups I, II and III to the Fourth Assessment Report of the Intergovernmental Panel on Climate Change. Intergovernmental Panel on Climate Change,Geneva. |
| [9] | Bhowmik S K, Titov S, Islam M M, Siddika A, Sultana S, Haque M S.2009. Phenotypic and genotypic screening of rice genotypes at seedling stage for salt tolerance. Afr J Biotechnol, 8(23): 6490-6494. |
| [10] | Dahal K, Knowles V L, Plaxton W C, Hüner N P A.2014. Enhancement of photosynthetic performance, water use efficiency and grain yield during long-term growth under elevated CO2 in wheat and rye is growth temperature and cultivar dependent.Environ Exp Bot, 106: 207-220. |
| [11] | Dionisio-Sese M I, Tobita S.2000. Effects of salinity on sodium content and photosynthetic responses of rice seedings differings in salt tolerance.Plant Physiol, 157(1): 54-58. |
| [12] | Dubois M, Gilles K A, Hamilton J K, Rebers P A, Smith F.1956. Colorimetric method for determination of sugars and related substances.Anal Chem, 28(3): 350-356. |
| [13] | Echarte L, Rothstein S, Tollenaar M.2008. The response of leaf photosynthesis and dry matter accumulation to nitrogen supply in an older and a newer maize hybrid.Crop Sci, 48(2): 656-665. |
| [14] | El-Hendawy S E, Hu Y, Yakout G M, Awad A M, Hafiz S E, Schmidhalter U.2005. Evaluating salt tolerance of wheat genotypes using multiple parameters.Eur J Agron, 22(3): 243-253. |
| [15] | Gao J P, Chao D Y, Lin H X.2007. Understanding abiotic stress tolerance mechanisms: Recent studies on stress response in rice.J Integr Plant Biol, 49(6): 742-750. |
| [16] | Ghosh N, Adak M K, Ghosh P D, Gupta S, Sen Gupta D N, Mandal C.2011. Differential responses of two rice varieties to salt stress.Plant Biotechnol Rep, 5(1): 89-103. |
| [17] | Hakim M A, Juraimi A S, Hanafi M M, Ismail M R, Selamat A, Rafii M Y, Latif M A.2014. Biochemical and anatomical changes and yield reduction in rice (Oryza sativa L.) under varied salinity regimes. BioMed Res Int, 2014(6): 208584. |
| [18] | Hakim M A, Juraimi A S, Hanafi M M, Ali E, Ismail M R, Selamat A, Rezaul Karim S M.2014. Effect of salt stress on morpho- physiology, vegetative growth and yield of rice.Exp Biol, 35(2): 317-326. |
| [19] | Hasegawa P M, Bressan R A, Zhu J K, Bohnert H J.2000. Plant cellular and molecular responses to high salinity.Annu Rev Plant Biol, 51: 463-499. |
| [20] | Heath R L, Packer L.1968. Photoperoxidation in isolated chloroplasts: I. Kinetics and stoichiometry of fatty acid peroxidation.Arch Biochem Biophysiol, 125(1): 189-198. |
| [21] | Huang Y Z, Zhang G P, Wu F B, Chen J X, Xiao Y P.2006. Interaction of salinity and cadmium stresses on antioxidant enzymes, sodium, and cadmium accumulation in four barley genotypes.J Plant Nutr, 29: 2215-2225. |
| [22] | IPCC. 2014. Climate Change 2013:The Physical Science Basis: Working Group I Contribution to the Fifth Assessment Report of the Intergovernmental Panel on Climate Change. London, UK: Cambridge University Press. |
| [23] | Kamyab-Talesh F, Mousavi S F, Asadi R, Rezaei M, Khaledian M R.2014. Evaluation of some rice cultivars’ response to salinity stress using resistance indices.Arch Agron Soil Sci, 60(9): 1303-1314. |
| [24] | Kim H Y, Lieffering M, Kobayashi K, Okada M, Miura S.2003. Seasonal changes in the effects of elevated CO2 on rice at three levels of nitrogen supply: A free air CO2 enrichment (FACE) experiment.Global Change Biol, 9(6): 826-837. |
| [25] | Kimball B A, Kobayashi K, Bindi M.2002. Responses of agricultural crops to free-air CO2 enrichment.Adv Agron, 77: 293-368. |
| [26] | Levitt J.1980. Responses of plants to environmental stresses. Acad Press, 1(5): 3642-3645. |
| [27] | Liang Y C.1999. Effects of silicon on enzyme activity and sodium, potassium and calcium concentration in barley under salt stress.Plant Soil, 209: 217-224. |
| [28] | Long S P, Ainsworth E A, Rogers A, Ort D R.2004. Rising atmospheric carbon dioxide: Plants FACE the Future.Annu Rev Plant Biol, 55: 591-628. |
| [29] | Makino A, Harada M, Sato T, Nakano H, Mae T.1997. Growth and N allocation in rice plants under CO2 enrichment.Plant Physiol, 115: 199-203. |
| [30] | Mathur N, Singh J, Bohra S, Bohra A, Vyas A.2006. Biomass production, productivity and physiological changes in moth bean genotypes at different salinity levels.Am J Plant Physiol, 1(2): 210-213. |
| [31] | Mohammadzadeh M, Peyghambari S A, Nabipoor A, Norouzi M.2008. Evaluation of grain yield and morphological characteristics in salt tolerant and sensitive rice genotypes. In: Proceedings of the 10th Iranian Agronomy and Plant Breeding. Iran: Seed and Plant Improvement Institute. |
| [32] | Moradi F, Ismail A M.2007. Responses of photosynthesis, chlorophyll fluorescence and ROS-scavenging systems to salt stress during seedling and reproductive stages in rice.Ann Bot, 99(6): 1161-1173. |
| [33] | Munns R, Termaat A.1986. Whole-plant responses to salinity.Funct Plant Biol, 13(1): 143-160. |
| [34] | Munns R, Tester M.2008. Mechanisms of salinity tolerance.Annu Rev Plant Biol, 59: 651-681. |
| [35] | Nielsen D C, Nelson N O.1998. Black bean sensitivity to water stress at various growth stages.Crop Sci, 38(2): 422-427. |
| [36] | Parvaiz A, Satyawati S.2008. Salt stress and phyto-biochemical responses of plants: A review.Plant Soil Environ, 3: 89-99. |
| [37] | Pérez-López U, Miranda-Apodaca J, Muñoz-Rueda A, Mena-Petite A.2013. Lettuce production and antioxidant capacity are differentially modified by salt stress and light intensity under ambient and elevated CO2.J Plant Physiol, 170: 1517-1525. |
| [38] | Pérez-López U, Robredo A, Lacuesta M, Sgherri C, Muñoz-Rueda A, Navari-Izzo F, Mena-Petite A.2009. The oxidative stress caused by salinity in two barley cultivars is mitigated by elevated CO2.Physiol Plant, 135(1): 29-42. |
| [39] | Pérez-López U, Robredo A, Lacuesta M, Mena-Petite A, Muñoz- Rueda A.2012. Elevated CO2 reduces stomatal and metabolic limitations on photosynthesis caused by salinity in Hordeum vulgare.Photosynth Res, 111(3): 269-283. |
| [40] | Rawson H M, Richards R A, Munns R.1988. An examination of selection criteria for salt tolerance in wheat, barley and triticale genotypes.Crop Pasture Sci, 39(5): 759-772. |
| [41] | Rontein D, Basset G, Hanson A D.2002. Metabolic engineering of osmoprotectant accumulation in plants.Metab Eng, 4(1): 49-56. |
| [42] | Roy R N, Mistra R V.2002. Economic and environmentol impact of improved nitrogen management in Asia rice farming systems. In: Proceedings of the 20th session of the International rice commission. Bangkok, Thailand, 23-26July 2002. |
| [43] | Sadr S, Afyuni M, Movahedi R Z.2013. Mapping soil salinity in arid and semi-arid soil by geostatic theory (Esfahan Province).Geo Environ Hazards, 2(7): 27-30. |
| [44] | Saffan S E.2008. Effect of salinity and osmotic stresses on some economic plants.Res J Agric Biol Sci, 4(2): 159-166. |
| [45] | Sanchez D H, Siahpoosh M R, Roessner U, Udvardi M, Kopka J.2008. Plant metabolomics reveals conserved and divergent metabolic responses to salinity.Physiol Plant, 132(2): 209-219. |
| [46] | Sasaki H, Hara T, Ito S, Uehara N, Kim H Y, Lieffering M, Okada M, Kobayashi K.2007. Effect of free-air CO2 enrichment on the storage of carbohydrate fixed at different stages in rice (Oryza sativa L.). Field Crops Res, 100(1): 24-31. |
| [47] | Satapathy S S, Swain D K, Herath S.2014. Field experiments and simulation to evaluate rice cultivar adaptation to elevated carbon dioxide and temperature in sub-tropical India.Eur J Agron, 54: 21-33. |
| [48] | Schapendonk A H C M, van Oijen M, Dijkstra P, Pot C S, Jordi W J R M, Stoopen G M.2000. Effects of elevated CO2 concentration on photosynthetic acclimation and productivity of two potato cultivars grown in open-top chambers.Funct Plant Biol, 27: 1119-1130. |
| [49] | Schütz M, Fangmeier A.2001. Growth and yield responses of spring wheat (Triticum aestivum L. cv. Minaret) to elevated CO2 and water limitation. Environ Pollut, 114(2): 187-194. |
| [50] | Seneweera S.2011. Effects of elevated CO2 on plant growth and nutrient partitioning of rice (Oryza sativa L.) at rapid tillering and physiological maturity. J Plant Int, 6: 35-42. |
| [51] | Shimono H, Bunce J A.2009. Acclimation of nitrogen uptake capacity of rice to elevated atmospheric CO2 concentration.Ann Bot, 103(1): 87-94. |
| [52] | Shimono H, Okada M, Yamakawa Y, Nakamura H, Kobayashi K, Hasegawa T.2009. Genotypic variation in rice yield enhancement by elevated CO2 relates to growth before heading, and not to maturity group.J Exp Bot, 60(2): 523-532. |
| [53] | Strogonov B P.1973. Structure and function of plant cells in saline habitats. In: Gollek B. Halstead Press. New York: John Wiley & Sons: 284. |
| [54] | Sultana N, Ikeda T, Itoh R.1999. Effect of NaCl salinity on photosynthesis and dry matter accumulation in developing rice grains.Environ Exp Bot, 42(3): 211-220. |
| [55] | Takagi M, El-Shemy H A, Sasaki S, Toyama S, Kanai S, Saneoka H, Fujita K.2009. Elevated CO2 concentration alleviates salinity stress in tomato plant.Acta Agric Scand B-S P, 59: 87-96. |
| [56] | Tanji K.1990. Nature and extent of agricultural salinity. In: Tanji K K. Agricultural Salinity Assessment and Management. New York: Am Soc Civ Engineers: 1-17. |
| [57] | Pattanagul W, Thitisaksakul M.2008. Effect of salinity stress on growth and carbohydrate metabolism in three rice (Oryza sativa L.) cultivars differing in salinity tolerance. Ind J Exp Biol, 46: 736-742. |
| [58] | Ueda A, Yahagi H, Fujikawa Y, Nagaoka T, Esaka M, Calcaño M, González M M, Hernández Martich J D, Saneoka H.2013. Comparative physiological analysis of salinity tolerance in rice.Soil Sci Plant Nutr, 59: 896-903. |
| [59] | Vijayalakshmi D, Ashok S K, Raveendran M.2014. Screening for salinity stress tolerance in rice and finger millet genotypes using shoot Na+/K+ ratio and leaf carbohydrate contents as key physiological traits.Ind J Plant Physiol, 19(2): 156-160. |
| [60] | Volkenburgh E V.1999. Leaf expansion: An integrating plant behaviour.Plant Cell Environ, 22: 1463-1473. |
| [61] | Xu Z J, Zheng X H, Wang Y S, Wang Y L, Huang Y, Zhu J G.2006. Effect of free-air atmospheric CO2 enrichment on dark respiration of rice plants (Oryza sativa L.). Agric Ecosyst Environ, 115: 105-112. |
| [62] | Yang L X, Liu H J, Wang Y X, Zhu J G, Huang J Y, Liu G, Dong G C, Wang Y L.2009a. Impact of elevated CO2 concentration on inter-subspecific hybrid rice cultivar Liangyoupeijiu under fully open-air field conditions.Field Crops Res, 112(1): 7-15. |
| [63] | Yang L X, Liu H J, Wang Y X, Zhu J G, Huang J Y, Liu G, Dong G C, Wang Y L.2009b. Yield formation of CO2-enriched inter-subspecific hybrid rice cultivar Liangyoupeijiu under fully open-air field condition in a warm sub-tropical climate.Agric Ecosyst Environ, 129: 193-200. |
| [64] | Yoshida S, Forno D A, Cock J H, Gomez K A.1972. Laboratory Manual for Physiological studies of Rice. Los Banos, the Philippines:International Rice Research Institute. |
| [65] | Zeng L, Poss J A, Wilson C, Draz A S E, Gregorio G B, Grieve C M.2003. Evaluation of salt tolerance in rice genotypes by physiological characters.Euphytica, 129(3): 281-292. |
| [66] | Zhang Z H, Liu Q, Song H X, Rong X M, Ismail A M.2012. Responses of different rice (Oryza sativa L.) genotypes to salt stress and relation to carbohydrate metabolism and chlorophyll content. Afr J Agric Res, 7(1): 19-27. |
| [67] | Zhao G Q, Ma B L, Ren C Z.2007. Growth, gas exchange, chlorophyll fluorescence and ion content of naked oat in response to salinity.Crop Sci, 47(1): 123-131. |
| [1] | Zhou Ying, Wan Tao, Yuan Bin, Lei Fang, Chen Meijuan, Wang Qiong, Huang Ping, Kou Shuyan, Qiu Wenxiu, Liu Li. Improving Rice Blast Resistance by Mining Broad-Spectrum Resistance Genes at Pik Locus [J]. Rice Science, 2022, 29(2): 133-142. |
| [2] | Jinjun Zhou, Peina Ju, Fang Zhang, Chongke Zheng, Bo Bai, Yaping Li, Haifeng Wang, Fan Chen, Xianzhi Xie. OsSRK1, an Atypical S-Receptor-Like Kinase Positively Regulates Leaf Width and Salt Tolerance in Rice [J]. Rice Science, 2020, 27(2): 133-142. |
| [3] | Pathaichindachote Wanwarang, Panyawut Natjaree, Sikaewtung Kannika, Patarapuwadol Sujin, Muangprom Amorntip. Genetic Diversity and Allelic Frequency of Selected Thai and Exotic Rice Germplasm Using SSR Markers [J]. Rice Science, 2019, 26(6): 393-403. |
| [4] | Donde Ravindra, Kumar Jitendra, Gouda Gayatri, Kumar Gupta Manoj, Mukherjee Mitadru, Yasin Baksh Sk, Mahadani Pradosh, Kumar Sahoo Khirod, Behera Lambodar, Kumar Dash Sushanta. Assessment of Genetic Diversity of Drought Tolerant and Susceptible Rice Genotypes Using Microsatellite Markers [J]. Rice Science, 2019, 26(4): 239-247. |
| [5] | Xiongsiyee Vua, Rerkasem Benjavan, Veeradittakit Jeeraporn, Saenchai Chorpet, Lordkaew Sittichai, Thebault Prom-u-thai Chanakan. Variation in Grain Quality of Upland Rice from Luang Prabang Province, Lao PDR [J]. Rice Science, 2018, 25(2): 94-102. |
| [6] | Naga Bheema Lingeswara Reddy Inja, Kim Sung-Mi, Kim Beom-Ki, Yoon In-Sun, Kwon Taek-Ryoun. Identification of Rice Accessions Associated with K+/Na+ Ratio and Salt Tolerance Based on Physiological and Molecular Responses [J]. Rice Science, 2017, 24(6): 360-364. |
| [7] | Naga Bheema Lingeswara Reddy Inja, Kim Beom-Ki, Yoon In-Sun, Kim Kyung-Hwan, Kwon Taek-Ryoun. Salt Tolerance in Rice: Focus on Mechanisms and Approaches [J]. Rice Science, 2017, 24(3): 123-144. |
| [8] | Rekha Talukdar Preeti, Rathi Sunayana, Pathak Khanin, Kumar Chetia Sanjay, Nath Sarma Ramendra. Population Structure and Marker-Trait Association in Indigenous Aromatic Rice [J]. Rice Science, 2017, 24(3): 145-154. |
| [9] | Jini D., Joseph B.. Physiological Mechanism of Salicylic Acid for Alleviation of Salt Stress in Rice [J]. Rice Science, 2017, 24(2): 97-108. |
| [10] | Anupam Alpana, Imam Jahangir, Mohammad Quatadah Syed, Siddaiah Anantha, Prasad Das Shankar, Variar Mukund, Prasad Mandal Nimai. Genetic Diversity Analysis of Rice Germplasm in Tripura State of Northeast India Using Drought and Blast Linked Markers [J]. Rice Science, 2017, 24(1): 10-20. |
| [11] | D. Chowdhury A., Haritha G., Sunitha T., L. Krishnamurthy S., Divya B., Padmavathi G., Ram T., Sarla N.. Haplotyping of Rice Genotypes Using Simple Sequence Repeat Markers Associated with Salt Tolerance [J]. Rice Science, 2016, 23(6): 317-325. |
| [12] | Haritha G., Sudhakar T., Chandra D., Ram T., Divya B., Sarla N.. Informative ISSR Markers Help Identify Genetically Distinct Accessions of Oryza rufipogon in Yield Improvement [J]. Rice Science, 2016, 23(5): 225-241. |
| [13] | Kumari Manisha, Asthir Bavita. Transformation of Sucrose to Starch and Protein in Rice Leaves and Grains under Two Establishment Methods [J]. Rice Science, 2016, 23(5): 255-265. |
| [14] | Mao-bai Li, Hui Wang, Li-ming Cao. Evaluation of Population Structure, Genetic Diversity and Origin of Northeast Asia Weedy Rice Based on Simple Sequence Repeat Markers [J]. Rice Science, 2015, 22(4): 180-188. |
| [15] | D. Kumbhar Shailesh, L. Kulwal Pawan, V. Patil Jagannath, D. Sarawate Chandrakant, P. Gaikwad Anil, S. Jadhav Ashok. Genetic Diversity and Population Structure in Landraces and Improved Rice Varieties from India [J]. Rice Science, 2015, 22(3): 99-107. |
| Viewed | ||||||
|
Full text |
|
|||||
|
Abstract |
|
|||||