Rice Science ›› 2026, Vol. 33 ›› Issue (1): 99-112.DOI: 10.1016/j.rsci.2025.10.002
• Research Papers • Previous Articles Next Articles
Zhou Jiaren1, Song Qingfeng2, Li Wanwan1, Zhang Mengqi1, Zhang Man1, Zhu Xinguang2( ), Wang Minjuan1()
Received:2025-05-21
Accepted:2025-08-21
Online:2026-01-28
Published:2026-02-03
Contact:
Wang Minjuan (About author:First author contact:# These authors contributed equally to this work
Zhou Jiaren, Song Qingfeng, Li Wanwan, Zhang Mengqi, Zhang Man, Zhu Xinguang, Wang Minjuan. High Throughput 3D Phenotyping of Canopy Occupation Volume as Major Predictor of Rice Canopy Photosynthesis[J]. Rice Science, 2026, 33(1): 99-112.
Add to citation manager EndNote|Ris|BibTeX
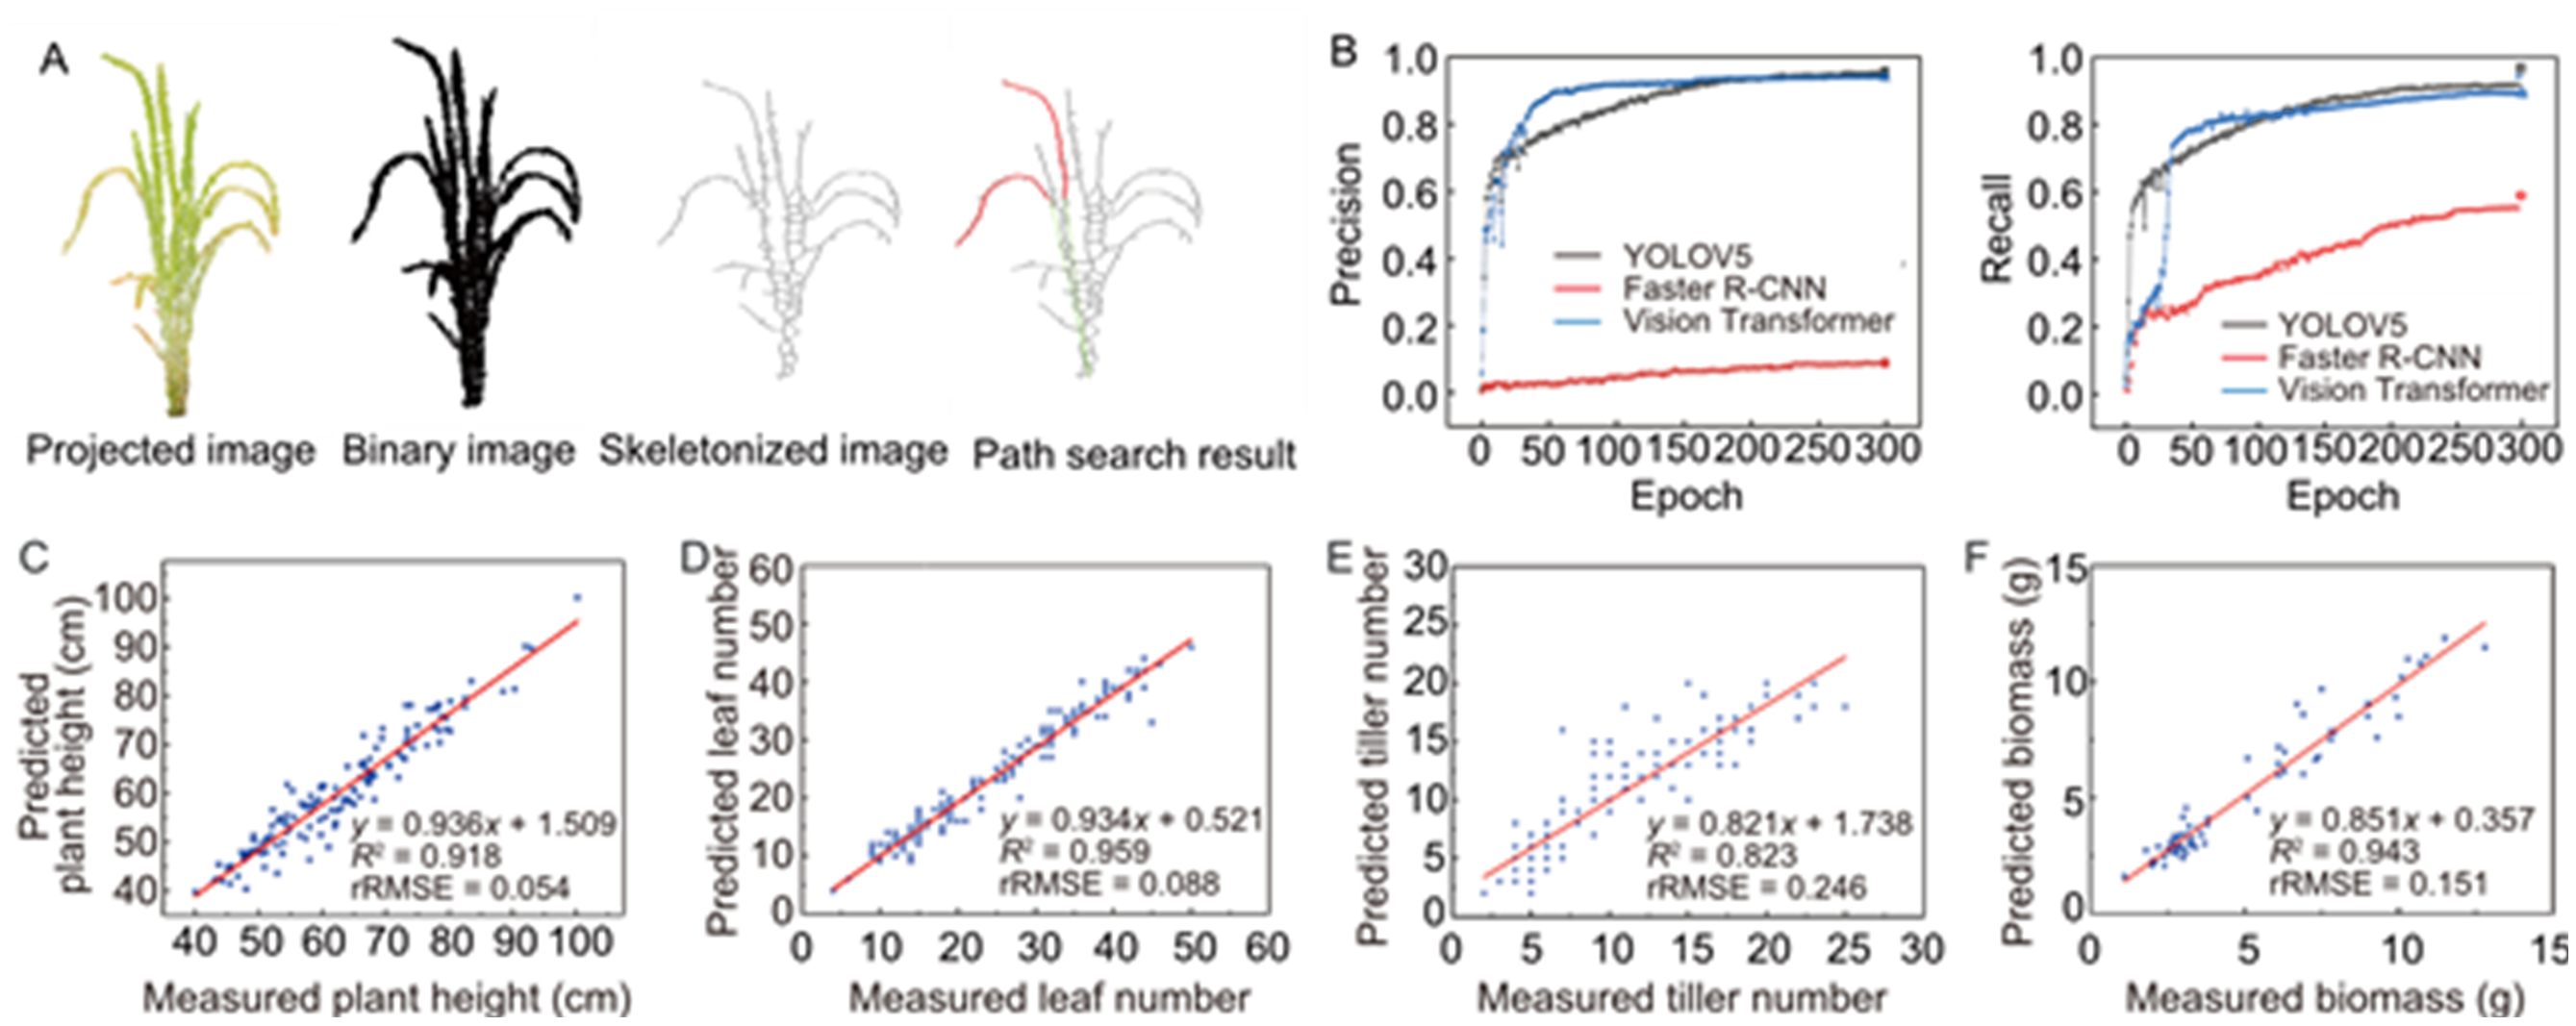
Fig. 1. Rice plant height extraction, leaf tip detection model performance, and phenotype prediction accuracy. A, Rice plant height extraction algorithm based on path search. In this figure, the red portion in the path represents the curved distance obtained from path searching, while the green section represents the straight-line distance from the connecting point to the base. B, Training process of the deep learning model for rice leaf tip detection reflects the changes in two metrics: precision and recall. C‒F, Extraction and correlation analysis of various rice canopy photosynthetic-related phenotypes. It illustrates the relationships between predicted values and actual values for plant height (C), leaf number (D), tiller number (E), and biomass (F), validating the effectiveness of the methods employed. rRMSE, Relative root mean square error.
| Model name | Precision | Recall | Average precision |
|---|---|---|---|
| YOLOv5 | 95.40 | 93.30 | 96.40 |
| Faster R-CNN | 8.62 | 54.99 | 40.27 |
| Vision Transformer | 93.80 | 90.50 | 94.20 |
Table 1. Results of leaf tip detection in rice using three deep learning models.
| Model name | Precision | Recall | Average precision |
|---|---|---|---|
| YOLOv5 | 95.40 | 93.30 | 96.40 |
| Faster R-CNN | 8.62 | 54.99 | 40.27 |
| Vision Transformer | 93.80 | 90.50 | 94.20 |
| Factor name | Tiller number | Biomass |
|---|---|---|
| Leaf number | 0.8832 | 0.8844 |
| Plant height (Coordinate difference method) | 0.4390 | 0.6340 |
| Plant height (Path searching method) | 0.4972 | 0.7069 |
| Canopy width | 0.7781 | 0.8907 |
| Point cloud number | 0.8316 | 0.9573 |
| Canopy occupation volume | 0.8489 | 0.7685 |
| Tiller number | 1.0000 | 0.7926 |
Table 2. Correlation between different factors and predictors.
| Factor name | Tiller number | Biomass |
|---|---|---|
| Leaf number | 0.8832 | 0.8844 |
| Plant height (Coordinate difference method) | 0.4390 | 0.6340 |
| Plant height (Path searching method) | 0.4972 | 0.7069 |
| Canopy width | 0.7781 | 0.8907 |
| Point cloud number | 0.8316 | 0.9573 |
| Canopy occupation volume | 0.8489 | 0.7685 |
| Tiller number | 1.0000 | 0.7926 |
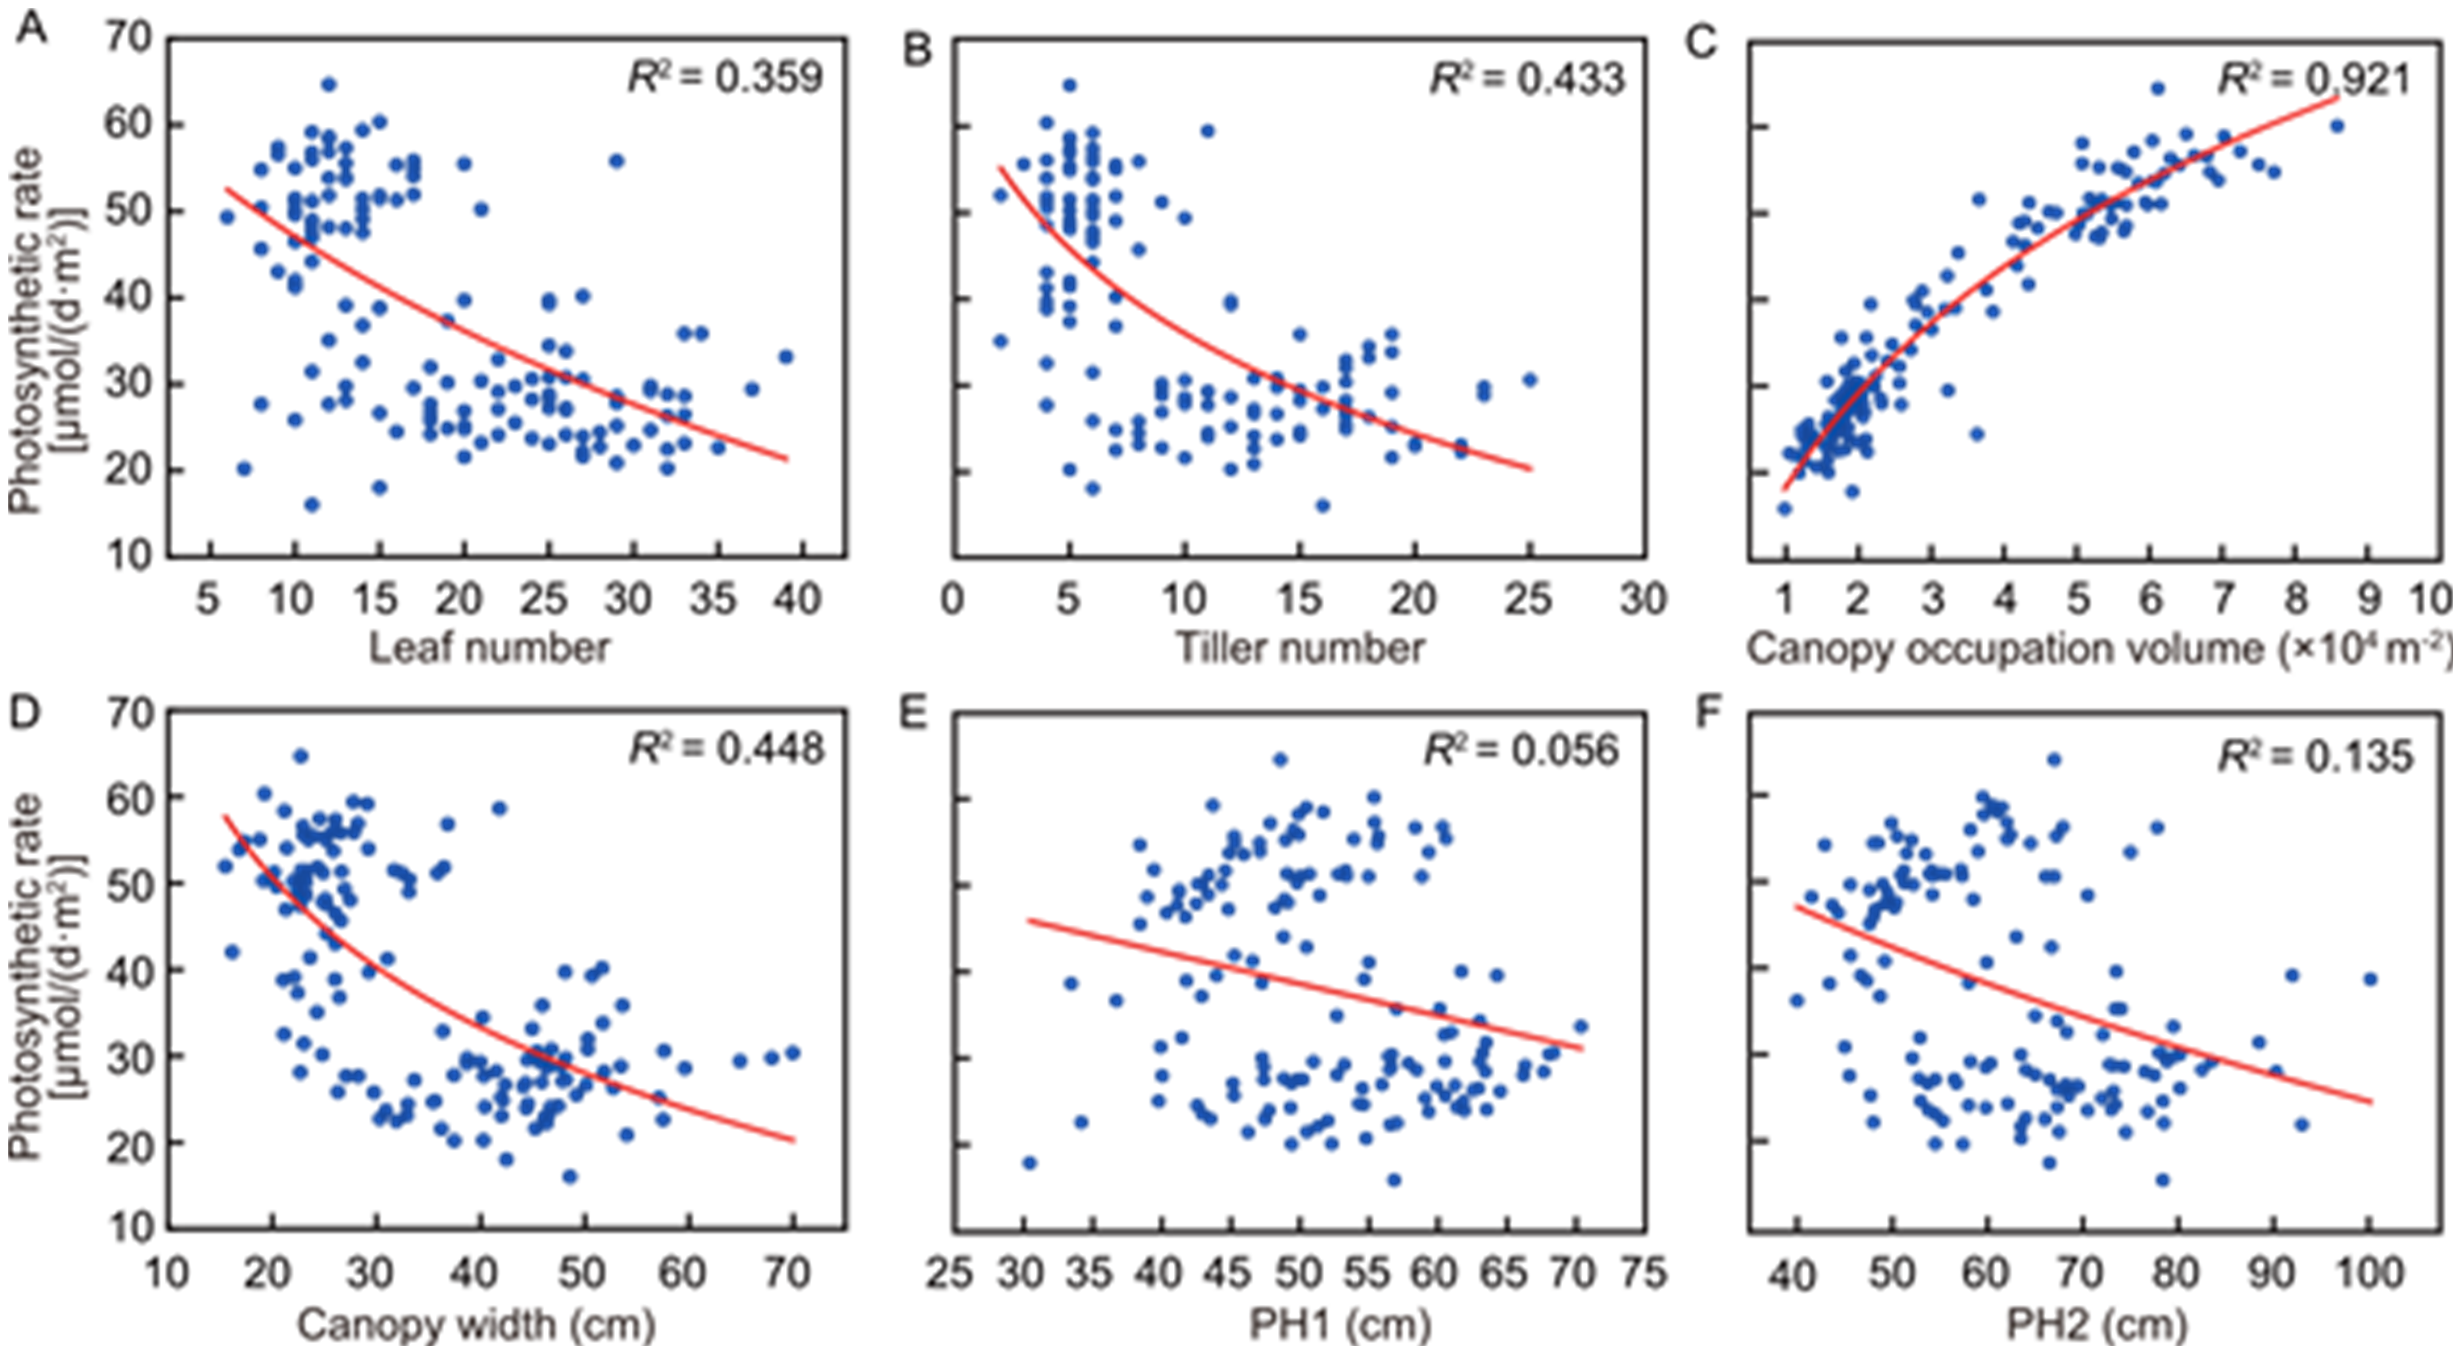
Fig. 2. Impacts of different canopy parameters on canopy photosynthetic rate in rice. A‒F, The R2 values of canopy photosynthetic rate with leaf number (A), tiller number (B), canopy occupation volume (C), canopy width (D), PH1 (plant height obtained using the coordinate difference method, E), and PH2 (plant height obtained using the path search method, F). Canopy occupation volume showed a strong correlation with photosynthetic rate.
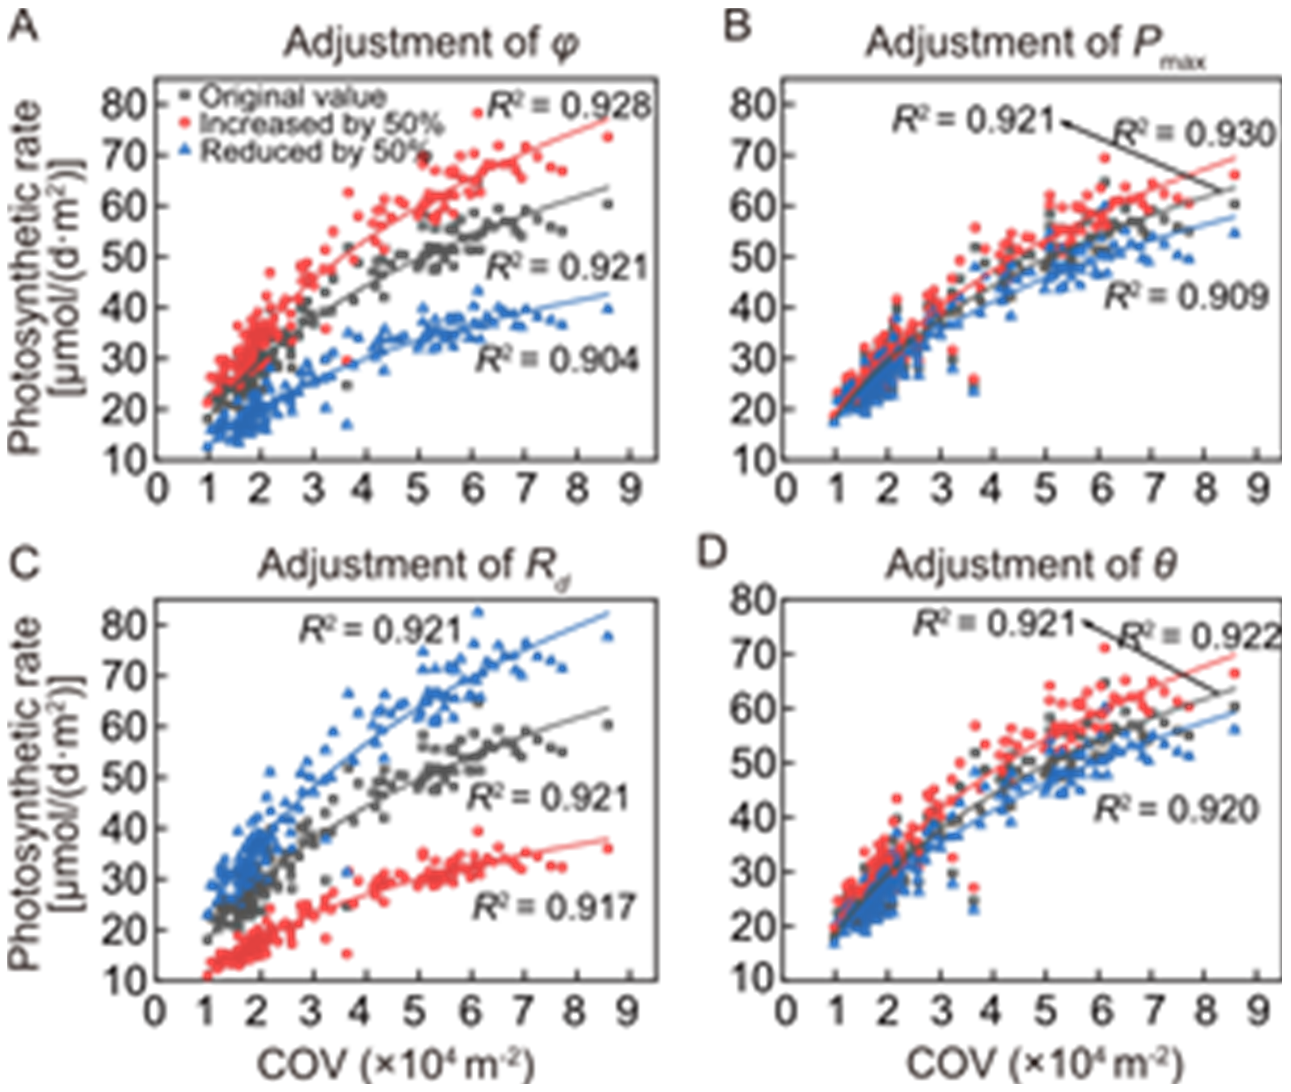
Fig. 3. Robustness of strong correlation between canopy occupation volume (COV) and canopy photosynthesis under different variations of parameters influencing photosynthetic rate-incident light intensity (A-Q) curve. The parameters contain quantum yield (ϕ, A), maximum photosynthetic rate (Pmax, B), dark respiration rate (Rd, C), and the A-Q curve’s curvature factor (θ, D).
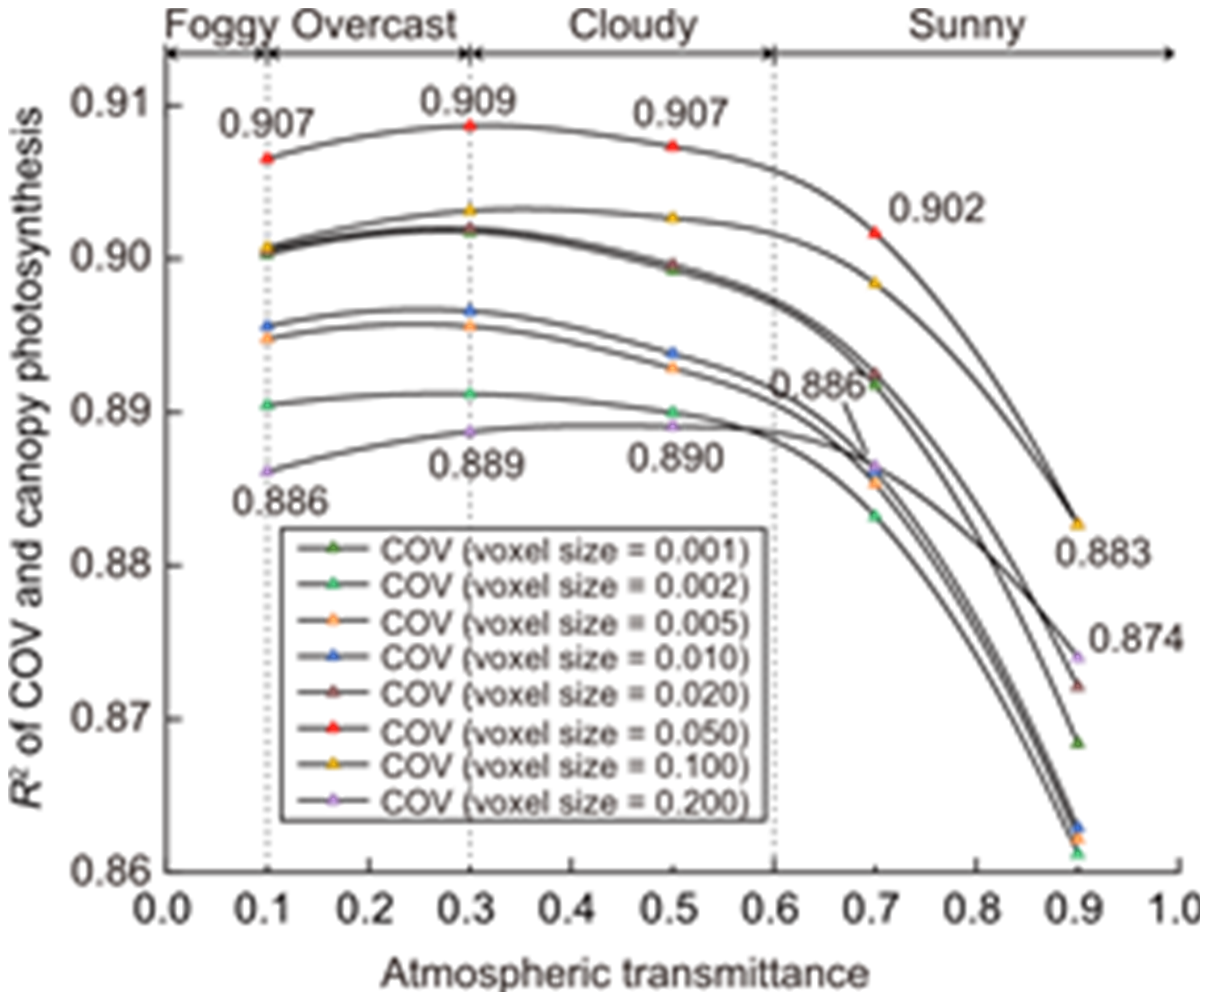
Fig. 4. Changes in R2 between canopy occupation volume (COV) and canopy photosynthesis under different atmospheric transmittance and voxel size conditions. Each curve represents the variation of R2 between COV and canopy photosynthesis as atmospheric transmittance changes for a specific voxel size. Atmospheric transmittance can simulate various real field weather conditions; for example, when atmospheric transmittance is less than 0.6, it represents maybe cloudy, overcast, or foggy weather, while atmospheric transmittance greater than 0.6 represents sunny conditions.
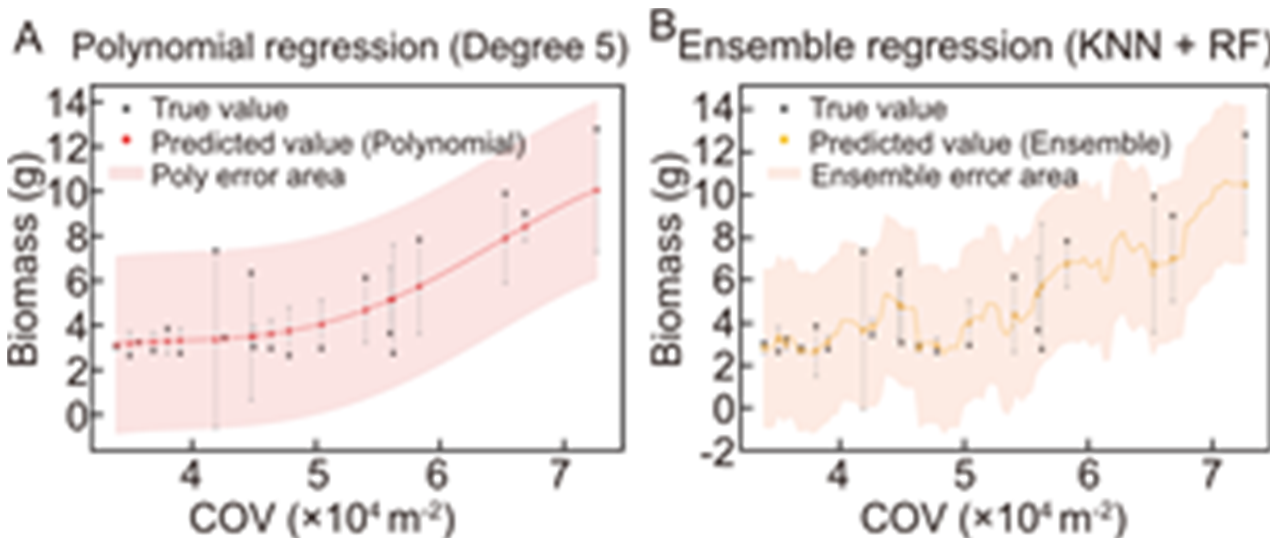
Fig. 5. Strong correlation between canopy occupation volume (COV) and biomass accumulation. A fifth-degree polynomial regression (A) and ensemble regression method [KNN (k-nearest neighbor) + RF (random forest)] (B) are presented in the graph. The black square points represent the biomass, while the red and orange circular points represent the regression predictions. The regression fitting curves are depicted by dashed lines, and the light red and light orange areas indicate the confidence interval region.
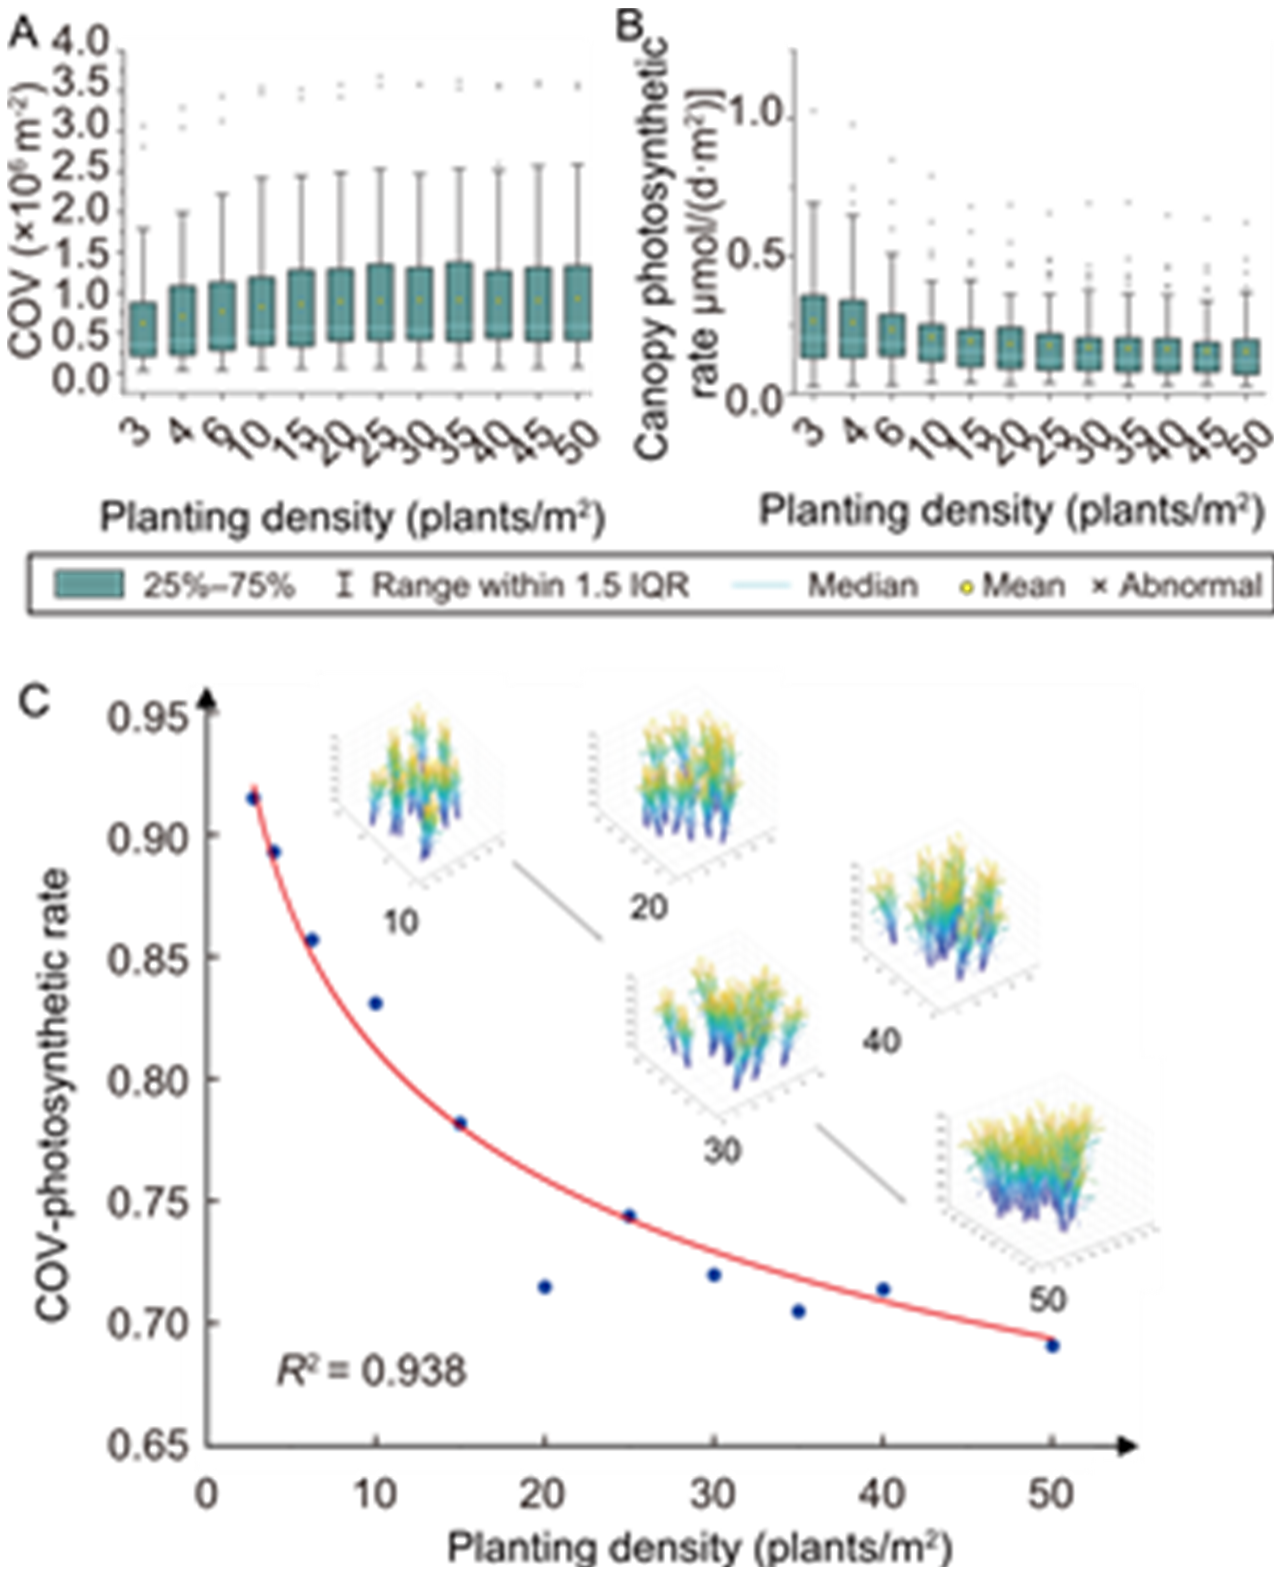
Fig. 6. Effect of planting density on correlation between canopy occupation volume (COV) and photosynthesis rate. A, Statistical data of community COV at different planting densities. B, Statistical data of canopy photosynthetic rate at different planting densities. C, Effect of planting density on R2 between COV and canopy photosynthetic rate.
| Factor | Low nitrogen dataset | High nitrogen dataset | |||
|---|---|---|---|---|---|
| Influence | R2 | Influence | R2 | ||
| Natural plant height | Negative | 0.39 | Uncorrelated | 0.00 | |
| Curved plant height | Negative | 0.19 | Uncorrelated | 0.01 | |
| Leaf number | Positive | 0.42 | Positive | 0.55 | |
| Tiller number | Positive | 0.41 | Positive | 0.39 | |
| Canopy width | Uncorrelated | 0.00 | Positive | 0.21 | |
| Point cloud number | Positive | 0.41 | Positive | 0.52 | |
Table 3. Effects of different canopy phenotypes on canopy occupation volume of rice.
| Factor | Low nitrogen dataset | High nitrogen dataset | |||
|---|---|---|---|---|---|
| Influence | R2 | Influence | R2 | ||
| Natural plant height | Negative | 0.39 | Uncorrelated | 0.00 | |
| Curved plant height | Negative | 0.19 | Uncorrelated | 0.01 | |
| Leaf number | Positive | 0.42 | Positive | 0.55 | |
| Tiller number | Positive | 0.41 | Positive | 0.39 | |
| Canopy width | Uncorrelated | 0.00 | Positive | 0.21 | |
| Point cloud number | Positive | 0.41 | Positive | 0.52 | |

Fig. 7. Impact of different rice canopy parameters on canopy occupation volume (COV). Confusion matrices of different phenotypes under low nitrogen (A) and high nitrogen (B) conditions. The impacts of individual canopy traits on COV under low nitrogen conditions are shown for plant height measured by the coordinate difference method (PH1, C), plant height measured by the path searching method (PH2, D), leaf number (LN, E), tiller number (TN, F), canopy width (CW, G), and point cloud number (PN, H). Under high nitrogen conditions, the effects of PH1 (I), PH2 (J), LN (K), TN (L), CW (M), and PN (N) on COV are presented.
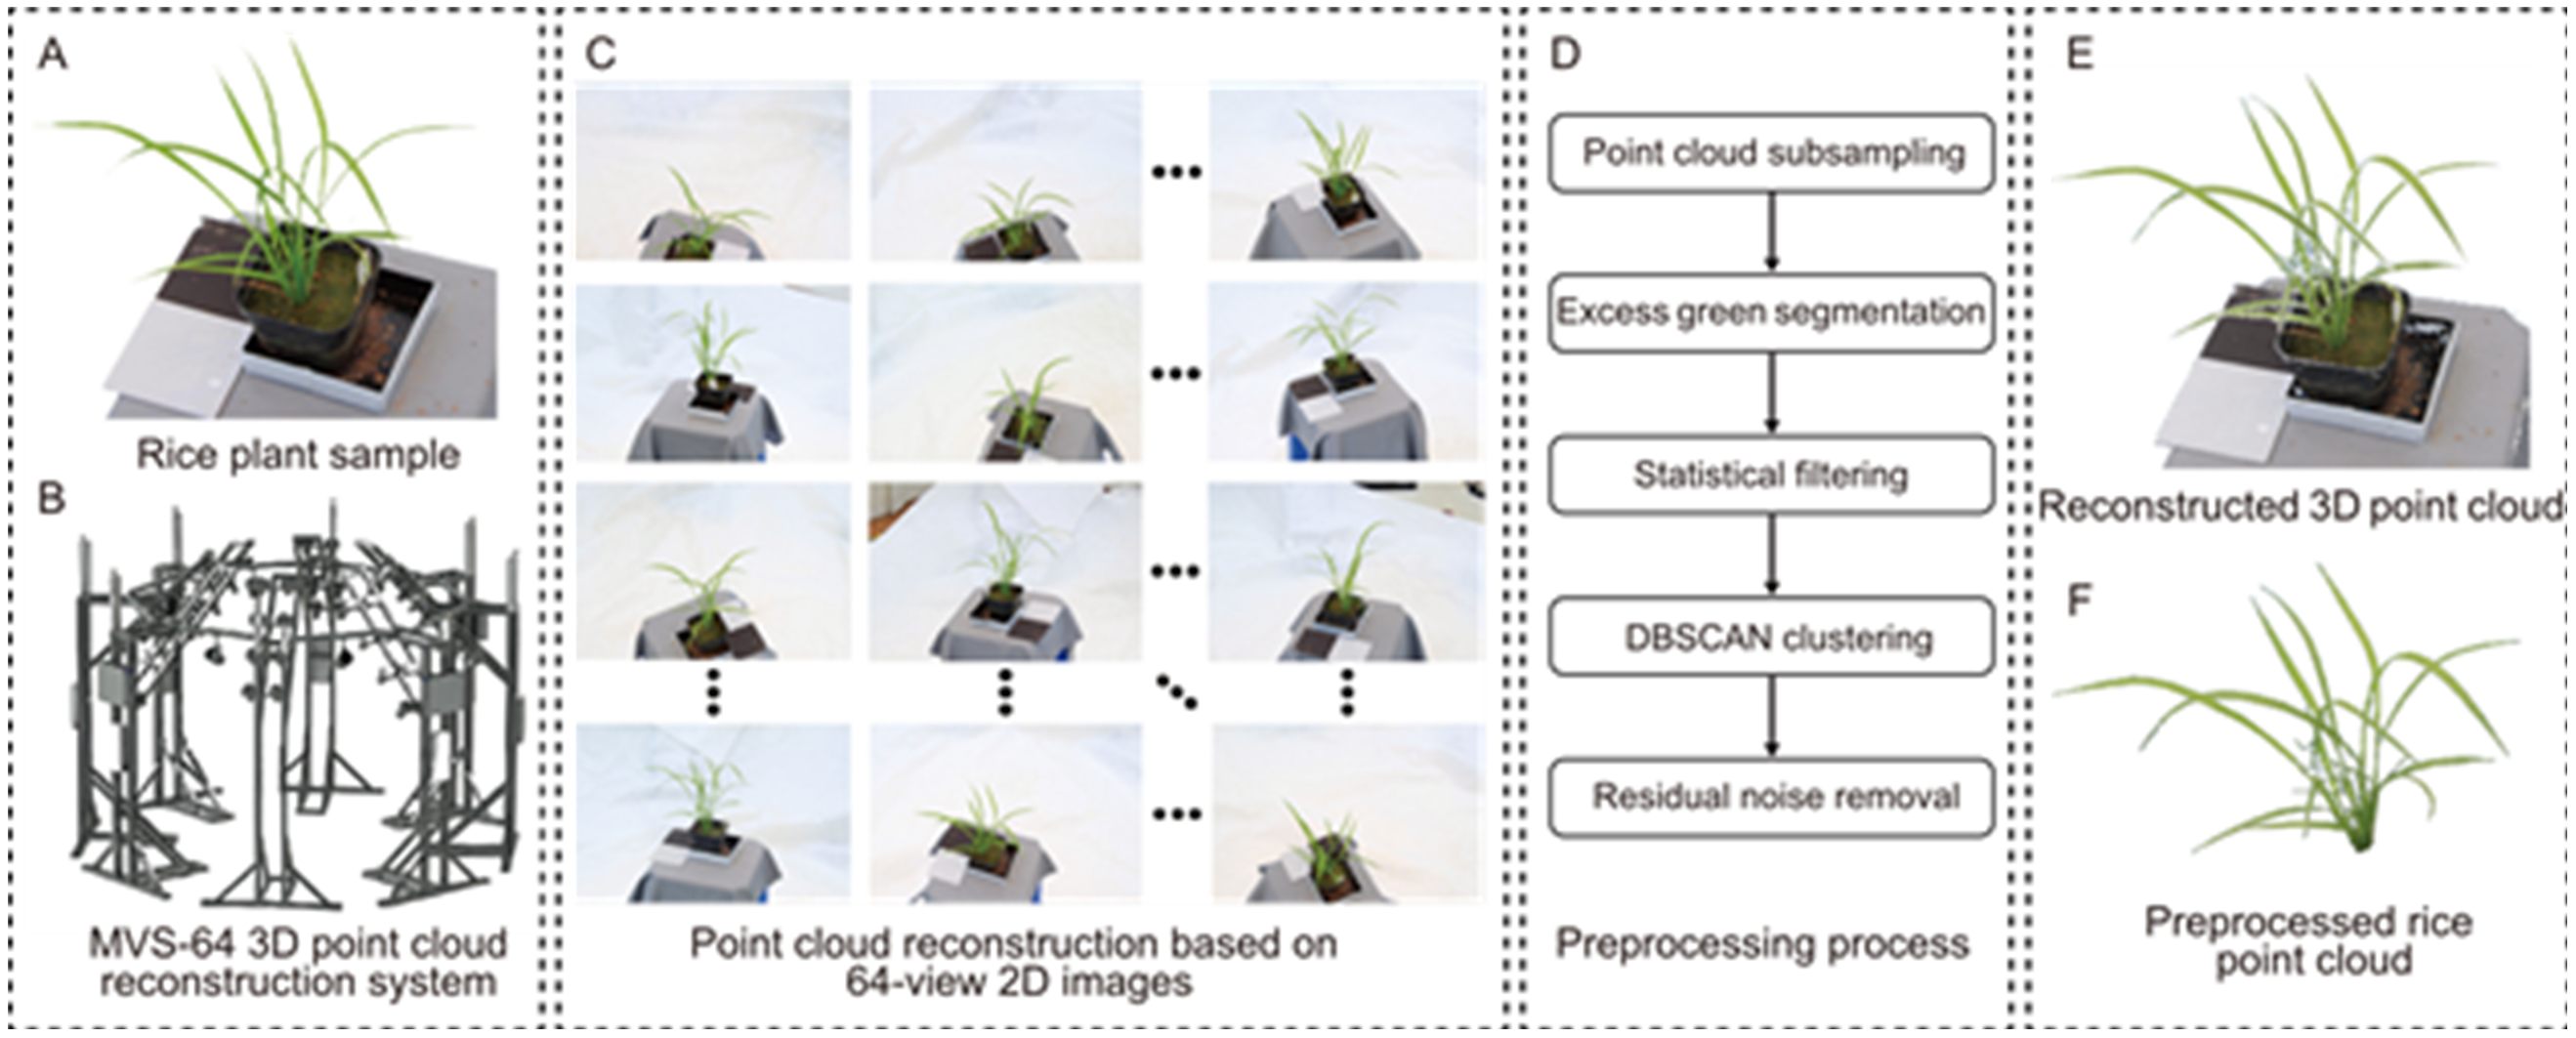
Fig. 8. Pipeline of rice point cloud acquisition and three-dimensional (3D) reconstruction. Rice point cloud (A) acquisition equipment, schematic diagram, and 3D reconstruction results. The multi-view-stereo 64-view (MVS-64) reconstruction system (B) captures two-dimensional (2D) images of rice plants from 64 different perspectives (C). Then the 3D point cloud was obtained by open source software (E), and the complete rice point cloud (F) was obtained by preprocessing (D), while canopy clustering was performed using the Density-Based Spatial Clustering of Applications with Noise (DBSCAN) algorithm.
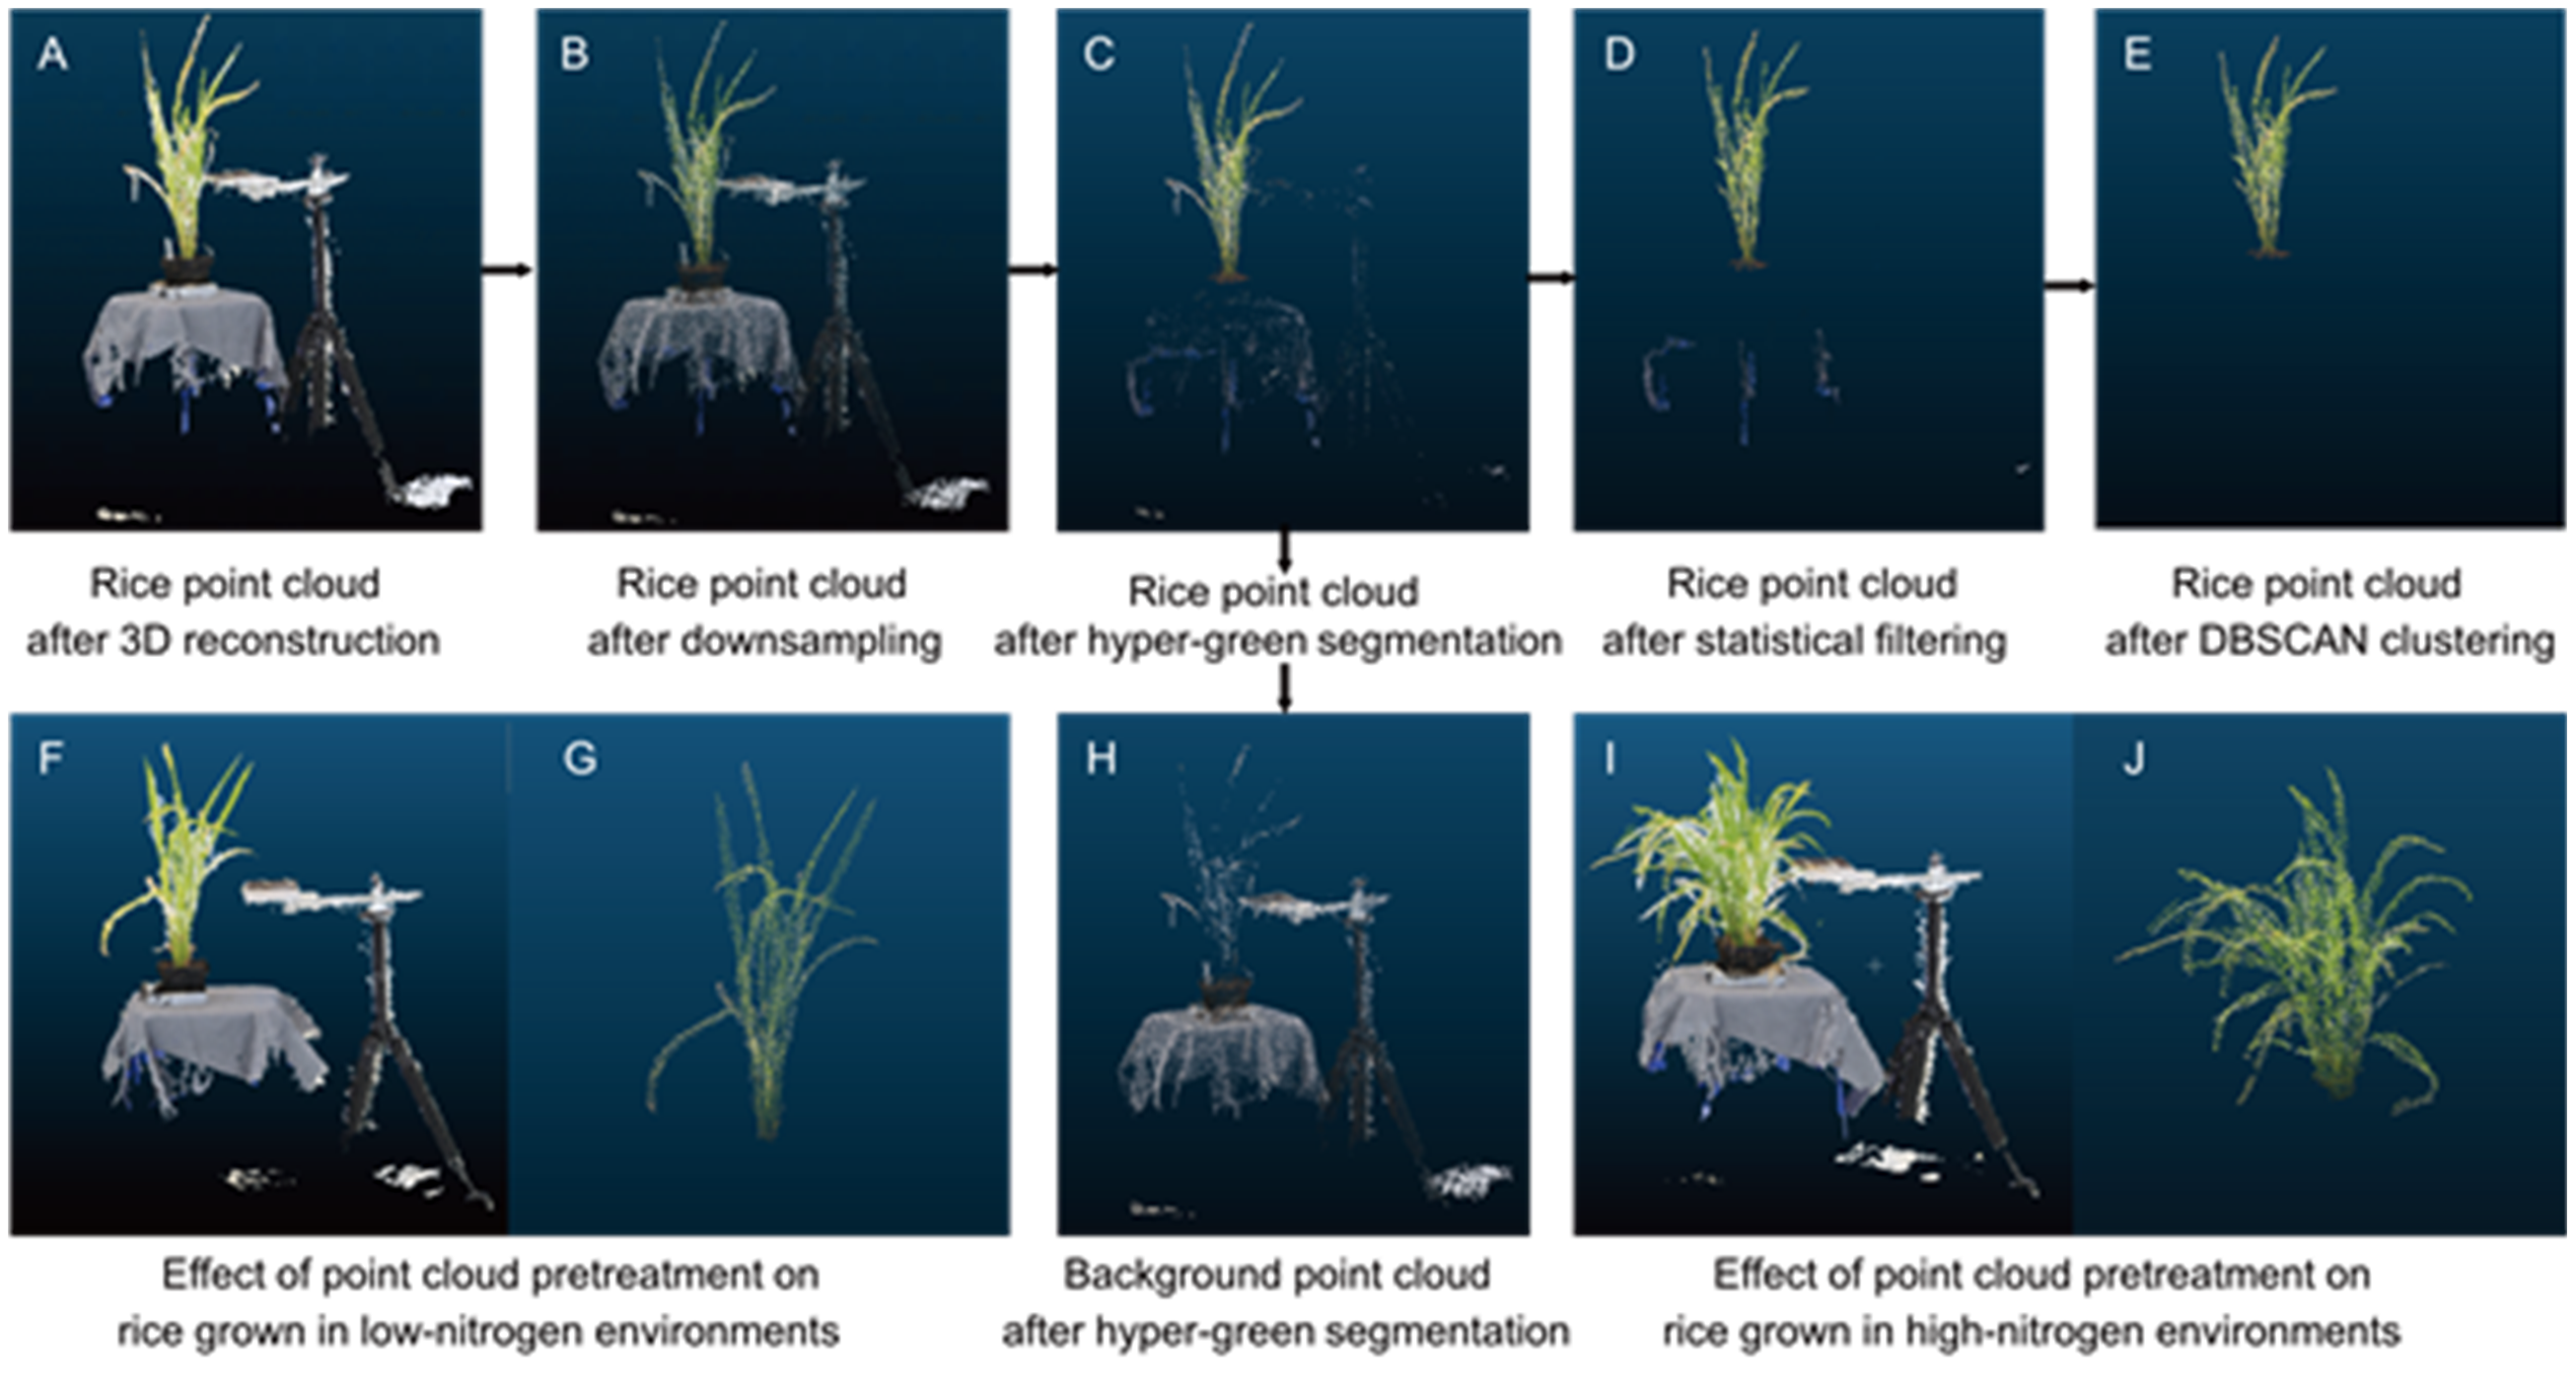
Fig. 9. Procedure of rice point cloud segmentation and denoising, along with a comparative analysis of pre-processing and post-processing outcomes. The original rice point (A) cloud data collected by the system undergoes downsampling (B), hyper-green segmentation (C), statistical filtering (D), and DBSCAN clustering (E) to obtain a high-quality rice plant point cloud. Hyper-green segmentation effectively separates plants (C) from irrelevant background (H). Finally, a comparison is presented between the point cloud segmentation and denoising results before processing (F and I) and after processing (G and J) for rice plants grown in low nitrogen (F) and high nitrogen (I) environments, respectively.
| [1] | Arya S, Sandhu K S, Singh J, et al. 2022. Deep learning: As the new frontier in high-throughput plant phenotyping. Euphytica, 218: 47. |
| [2] | Bannari A, Khurshid K S, Staenz K, et al. 2007. A comparison of hyperspectral chlorophyll indices for wheat crop chlorophyll content estimation using laboratory reflectance measurements. IEEE Trans Geosci Remote Sens, 45(10): 3063-3074. |
| [3] | Camino C, Gonzalez-Dugo V, Hernandez P, et al. 2019. Radiative transfer Vcmax estimation from hyperspectral imagery and SIF retrievals to assess photosynthetic performance in rainfed and irrigated plant phenotyping trials. Remote Sens Environ, 231: 111186. |
| [4] | Chang T G, Zhao H, Wang N, et al. 2019. A three-dimensional canopy photosynthesis model in rice with a complete description of the canopy architecture, leaf physiology, and mechanical properties. J Exp Bot, 70(9): 2479-2490. |
| [5] | Chen L H, Xu M, Cheng Z X, et al. 2024. Effects of nitrogen deficiency on the photosynthesis, chlorophyll a fluorescence, antioxidant system, and sulfur compounds in Oryza sativa. Int J Mol Sci, 25(19): 10409. |
| [6] | Chen Q M, Zheng B Y, Chenu K, et al.2022. Unsupervised plot-scale LAI phenotyping via UAV-based imaging, modelling, and machine learning. Plant Phenomics, 2022: 9768253. |
| [7] | Chen T W, Nguyen T M N, Kahlen K, et al. 2014. Quantification of the effects of architectural traits on dry mass production and light interception of tomato canopy under different temperature regimes using a dynamic functional-structural plant model. J Exp Bot, 65(22): 6399-6410. |
| [8] | Deng R L, Jiang Y, Tao M, et al. 2020. Deep learning-based automatic detection of productive tillers in rice. Comput Electron Agric, 177: 105703. |
| [9] | Evers J B, Vos J, Fournier C, et al. 2005. Towards a generic architectural model of tillering in Gramineae, as exemplified by spring wheat (Triticum aestivum). New Phytol, 166(3): 801-812. |
| [10] | Fageria N K, Santos A B, Cutrim V A. 2008. Dry matter and yield of lowland rice genotypes as influence by nitrogen fertilization. J Plant Nutr, 31(4): 788-795. |
| [11] | Gu S H, Wen W L, Xu T J, et al. 2022. Use of 3D modeling to refine predictions of canopy light utilization: A comparative study on canopy photosynthesis models with different dimensions. Front Plant Sci, 13: 735981. |
| [12] | Hickey L T, Hafeez A N, Robinson H, et al. 2019. Breeding crops to feed 10 billion. Nat Biotechnol, 37(7): 744-754. |
| [13] | Hwang I, Yoon S, Kim D, et al. 2023. Evaluation of the effects of supplemental lighting and stem number on greenhouse sweet pepper growth and yield via ray-tracing simulation with 3D plant models. Biosyst Eng, 226: 252-265. |
| [14] | Jin S C, Sun X L, Wu F F, et al. 2021. Lidar sheds new light on plant phenomics for plant breeding and management: Recent advances and future prospects. ISPRS J Photogramm Remote Sens, 171: 202-223. |
| [15] | Kawamura K, Asai H, Yasuda T, et al. 2020. Field phenotyping of plant height in an upland rice field in Laos using low-cost small unmanned aerial vehicles (UAVs). Plant Prod Sci, 23(4): 452-465. |
| [16] | Li Y. 2021. Morphological and structural phenotypes extraction of maize using multi-source data and deep learning. Changchun, China: Jilin Agricultural University. (in Chinese with English abstract) |
| [17] | Li Y L, Zhan X H, Liu S Y, et al. 2023. Self-supervised plant phenotyping by combining domain adaptation with 3D plant model simulations: Application to wheat leaf counting at seedling stage. Plant Phenomics, 5: 0041. |
| [18] | Liu F S, Song Q F, Zhao J K, et al. 2021a. Canopy occupation volume as an indicator of canopy photosynthetic capacity. New Phytol, 232(2): 941-956. |
| [19] | Liu F S, Hu P C, Zheng B Y, et al. 2021b. A field-based high-throughput method for acquiring canopy architecture using unmanned aerial vehicle images. Agric For Meteor, 296: 108231. |
| [20] | Liu S Y, Martre P, Buis S, et al. 2019. Estimation of plant and canopy architectural traits using the digital plant phenotyping platform. Plant Physiol, 181(3): 881-890. |
| [21] | Mattoccia S, Poggi M. 2015. A passive RGBD sensor for accurate and real-time depth sensing self-contained into an FPGA. In:Proceedings of the 9th International Conference on Distributed Smart Cameras. Seville, Spain: ACM: 146-151. |
| [22] | Nex F, Remondino F. 2014. UAV for 3D mapping applications: A review. Appl Geomat, 6(1): 1-15. |
| [23] | Oikawa S, Ainsworth E A. 2016. Changes in leaf area, nitrogen content and canopy photosynthesis in soybean exposed to an ozone concentration gradient. Environ Pollut, 215: 347-355. |
| [24] | Qiu R C, Zhang M, He Y. 2022. Field estimation of maize plant height at jointing stage using an RGB-D camera. Crop J, 10(5): 1274-1283. |
| [25] | Raj T, Hashim F H, Huddin A B, et al. 2020. A survey on LiDAR scanning mechanisms. Electronics, 9(5): 741. |
| [26] | Ren M M, Huang M H, Qiu H Y, et al. 2021. Genome-wide association study of the genetic basis of effective tiller number in rice. Rice, 14(1): 56. |
| [27] | Schönberger J L, Frahm J M. 2016. Structure-from-motion revisited. In: 2016 IEEE Conference on Computer Vision and Pattern Recognition (CVPR). June 27-30, 2016. Las Vegas, NV, USA: IEEE: 4104-4113. |
| [28] | Snavely N, Seitz S M, Szeliski R. 2008. Modeling the world from Internet photo collections. Int J Comput Vis, 80(2): 189-210. |
| [29] | Song Q F, Zhang G L, Zhu X G. 2013. Optimal crop canopy architecture to maximise canopy photosynthetic CO2 uptake under elevated CO2: A theoretical study using a mechanistic model of canopy photosynthesis. Funct Plant Biol, 40(2): 108-124. |
| [30] | Song Q F, Liu F S, Bu H Y, et al. 2023. Quantifying contributions of different factors to canopy photosynthesis in 2 maize varieties: Development of a novel 3D canopy modeling pipeline. Plant Phenomics, 5: 0075. |
| [31] | Sonobe R, Yamashita H, Mihara H, et al. 2020. Estimation of leaf chlorophyll a, b and carotenoid contents and their ratios using hyperspectral reflectance. Remote Sens, 12(19): 3265. |
| [32] | Sreekanta S, Haaning A, Dobbels A, et al. 2024. Variation in shoot architecture traits and their relationship to canopy coverage and light interception in soybean (Glycine max). BMC Plant Biol, 24(1): 194. |
| [33] | Wu C Y, Niu Z, Tang Q, et al. 2008. Estimating chlorophyll content from hyperspectral vegetation indices: Modeling and validation. Agric For Meteor, 148(8/9): 1230-1241. |
| [34] | Wu D. 2019. Research on 3D reconstruction of rice plant. Wuhan, China: Huazhong Agricultural University. (in Chinese with English abstract) |
| [35] | Xiao S F, Ye Y L, Fei S P, et al. 2023a. High-throughput calculation of organ-scale traits with reconstructed accurate 3D canopy structures using a UAV RGB camera with an advanced cross-circling oblique route. ISPRS J Photogramm Remote Sens, 201: 104-122. |
| [36] | Xiao S F, Fei S P, Li Q, et al. 2023b. The importance of using realistic 3D canopy models to calculate light interception in the field. Plant Phenomics, 5: 0082. |
| [37] | Xu X X, Zhang X, Ni W, et al. 2024. Nitrogen-potassium balance improves leaf photosynthetic capacity by regulating leaf nitrogen allocation in apple. Hortic Res, 11(1): uhad253. |
| [38] | Yang M, Cho S I. 2021. High-resolution 3D crop reconstruction and automatic analysis of phenotyping index using machine learning. Agriculture, 11(10): 1010. |
| [39] | Yang Y, Li M. 2020. A point cloud denoising method based on a hybrid filtering and density clustering. Metrol Test Technol, 47: 24-27. (in Chinese with English abstract) |
| [40] | Yao Y J, Liu Q, Liu Q H. 2009. Canopy modeling and validation for row planted crops of key growth stages. In: 2009 IEEE International Geoscience and Remote Sensing Symposium. July 12-17, 2009. Cape Town, South Africa: IEEE: 686-689. |
| [41] | Zhang T Y, Suen C Y. 1984. A fast parallel algorithm for thinning digital patterns. Commun ACM, 27(3): 236-239. |
| [42] | Zhi X Y, Massey-Reed S R, Wu A, et al.2022. Estimating photosynthetic attributes from high-throughput canopy hyperspectral sensing in sorghum. Plant Phenomics, 2022: 9768502. |
| [43] | Zhu X G, Long S P. 2009. Can increase in rubisco specificity increase carbon gain by whole canopy? A modeling analysis. In: Laisk A, Nedbal L, Govindjee. Photosynthesis in Silico: Advances in Photosynthesis and Respiration, Vol 29. Dordrecht, the Netherlands: Springer: 401-416. |
| [44] | Zhu X G, Song Q F, Ort D R. 2012. Elements of a dynamic systems model of canopy photosynthesis. Curr Opin Plant Biol, 15(3): 237-244. |
| [1] | Zhu Junlin, Zheng Guangjie, Tao Yi, Liao Wenli, Ye Chang, Xu Ya’nan, Xiao Deshun, Chu Guang, Xu Chunmei, Wang Danying. Wood Vinegar Enhances Seedling Rate of Rice Seeds under Flooding Stress by Mitigating Oxidative Damage and Maintaining Energy Homeostasis [J]. Rice Science, 2026, 33(1): 129-140. |
| [2] | An Shuaizu, Lü Jun, Ma Zemin, Gao Xuanlin, Zhang Biaoming, Yang Pingfang, Ke Yinggen. WRKY53: A Key Player in Stress Responses and Growth Regulation in Rice [J]. Rice Science, 2026, 33(1): 30-38. |
| [3] | Huang Qina, Wu Lijuan, Jiang Hongrui, He Yan, Liu Song, Yang Changdeng, Liang Yan. NRAMPs: Versatile Transporters Involved in Metal Ion Homeostasis and Their Applications in Rice Breeding [J]. Rice Science, 2026, 33(1): 39-58. |
| [4] | Pratap Kalita, Bedanta Bhattacharjee, Bhrigu Kumar Das, Saikat Sen, Raja Chakraborty, Abdul Baquee Ahmed. Rice Bran as Nutrient-Dense Food in Gut Health and Beyond [J]. Rice Science, 2026, 33(1): 59-80. |
| [5] | D. Priyanga, K. Amudha, N. Sakthivel, P. Sivasakthivelan, S. Utharasu, D. Uma, M. Sudha. Functional and Nutraceutical Potential of Indian Rice Landraces: A Comprehensive Scientific Review [J]. Rice Science, 2025, 32(6): 777-796. |
| [6] | Fazli Hameed, Shah Fahad Rahim, Anis Ur Rehman Khalil, Ram L. Ray, Xu Junzeng, Alhaj Yousef Hamoud, Akhtar Ali, Ning Tangyuan. Comparing Genotype and Climate Change Effects on Simulated Historical Rice Yields Using AquaCrop [J]. Rice Science, 2025, 32(6): 845-856. |
| [7] | Hong Chen, Luo Ju, Feng Zelin, Ling Heping, Li Lingyi, Wu Jian, Yao Qing, Liu Shuhua. Intelligent Survey Method for Tiny Rice Pests and Their Natural Predators in Paddy Fields Using Augmented Reality (AR) Glasses [J]. Rice Science, 2025, 32(6): 868-884. |
| [8] | Daisy Wilson, Valeria Gonzalez, Hamidreza Sharifan. Evaluating Efficacy of ZnO and MgO Nanoparticles on Post-Harvested Rice to Enhance Food Security Against Agroterrorism [J]. Rice Science, 2025, 32(5): 717-726. |
| [9] | Mareyam Mukhtar, Amresh Kumar, Ashfak S. Mujawar, Bhuvnesh Sareen, Suhas G. Karkute, Rohini Sreevathsa, Amitha Mithra Sevanthi, Amolkumar U. Solanke. Genome-Wide Identification of Dopamine β-Monooxygenase N-Terminal Gene Family in Rice and Its Role in Response to Blast Disease and Abiotic Stress [J]. Rice Science, 2025, 32(5): 685-703. |
| [10] | Li Haifeng, Fan Jiayi. Functions of Rice E3 Ubiquitin Ligases in Response to Environmental Stress and in Regulating Grain Size [J]. Rice Science, 2025, 32(5): 649-657. |
| [11] | Wu Zhaozhong, Zhong Zhengzheng, Xu Peng, Liu Ling, Wang Beifang, Yang Qinqin, Wen Xiaoxia, Ma Guifang, Luo Mili, Zhang Yingxin, Liu Qun’en, Peng Zequn, Zhan Xiaodeng, Cao Liyong, Cheng Shihua, Wu Weixun. OsELF3.1-OsCATA-Ghd7 Pathway Regulates Rice Heading [J]. Rice Science, 2025, 32(5): 658-672. |
| [12] | Pan Pan, Guo Wenlong, Li Hengbo, Shao Yifan, Guo Zhihao, Jin Ye, Cheng Yanrong, Yu Guoping, Fu Zhenshi, Hu Lin, Zheng Xiaoming, Zhou Guomin, Zhang Jianhua. Accelerating Wild Rice Disease-Resistant Germplasm Exploration: Artificial Intelligence (AI)-Powered Wild Rice Blast Disease Level Evaluation and Disease-Resistance Identification [J]. Rice Science, 2025, 32(5): 727-746. |
| [13] | Sabarinathan Selvaraj, Parameswaran Chidambaranathan, Goutam Kumar Dash, Priyadarsini Sanghamitra, Kishor Pundlik Jeughale, Cayalvizhi Balasubramaniasai, Devraj Lenka, Basavantraya Navadagi Devanna, Seenichamy Rathinam Prabhukarthikeyan, Sanghamitra Samantaray, Amaresh Kumar Nayak. Long-Range Admixture Linkage Disequilibrium and Allelic Responses of Sub1 and TPP7 under Consecutive Stress in Rice Validated Through Mendelian Randomization [J]. Rice Science, 2025, 32(5): 704-716. |
| [14] | Yong Jin Choi, Sun-Hwa Ha. Metabolic Engineering in Rice for Functional Metabolite Production [J]. Rice Science, 2025, 32(4): 475-498. |
| [15] | Dinuka Nuwan Tharaka, Nadeeka D. Tissera, Gayan Priyadarshana, Damayanthi Dahanayake. A Comprehensive Review of Hierarchical Porous Carbon Synthesis from Rice Husk [J]. Rice Science, 2025, 32(4): 499-511. |
| Viewed | ||||||
|
Full text |
|
|||||
|
Abstract |
|
|||||