
Rice Science ›› 2026, Vol. 33 ›› Issue (6): 834-844.DOI: 10.1016/j.rsci.2026.06.001
• Research Papers • Previous Articles Next Articles
Keiichi Honda1,#, Mao Suganami2,#, Hideki Yoshida2, Takashi Akagi3, Makoto Matsuoka2( ), Soichi Kojima1()
Received:2026-04-21
Accepted:2026-06-10
Online:2026-11-28
Published:2026-11-17
Contact:
Soichi Kojima (soichi.kojima.a2@tohoku.ac.jp);
Makoto Matsuoka (matsuoka@agri.fukushima-u.ac.jp)
About author:#These authors contributed equally to this work
Keiichi Honda, Mao Suganami, Hideki Yoshida, Takashi Akagi, Makoto Matsuoka, Soichi Kojima. Interaction of NAL1-OsSPY Modulated by Nitrogen Availability Controls Panicle Architecture in Rice[J]. Rice Science, 2026, 33(6): 834-844.
Add to citation manager EndNote|Ris|BibTeX
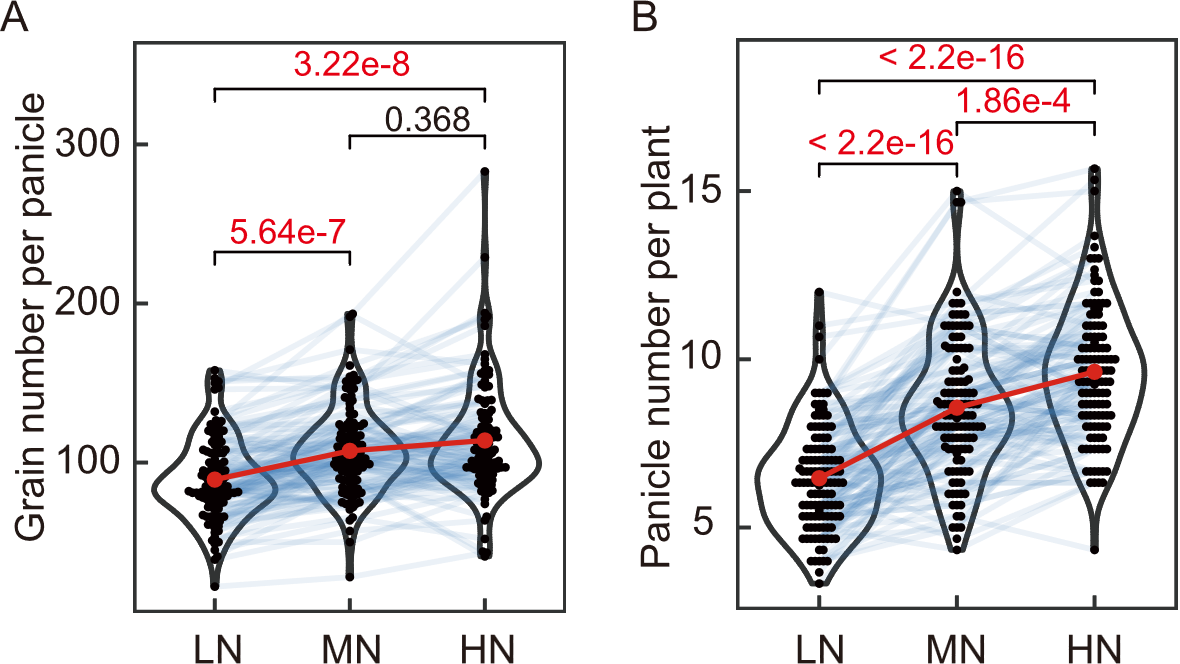
Fig. 1. Distribution of grain number per panicle (A) and panicle number per plant (B) under low-, medium-, and high-nitrogen (LN, MN, and HN) conditions. Violin plots indicate the distribution of phenotypic values in the population. Blue thin lines represent the responses of individual varieties across nitrogen conditions, whereas the thick red line indicates the population mean. P-values were calculated using Welch’s t-test and corrected by the Bonferroni method.
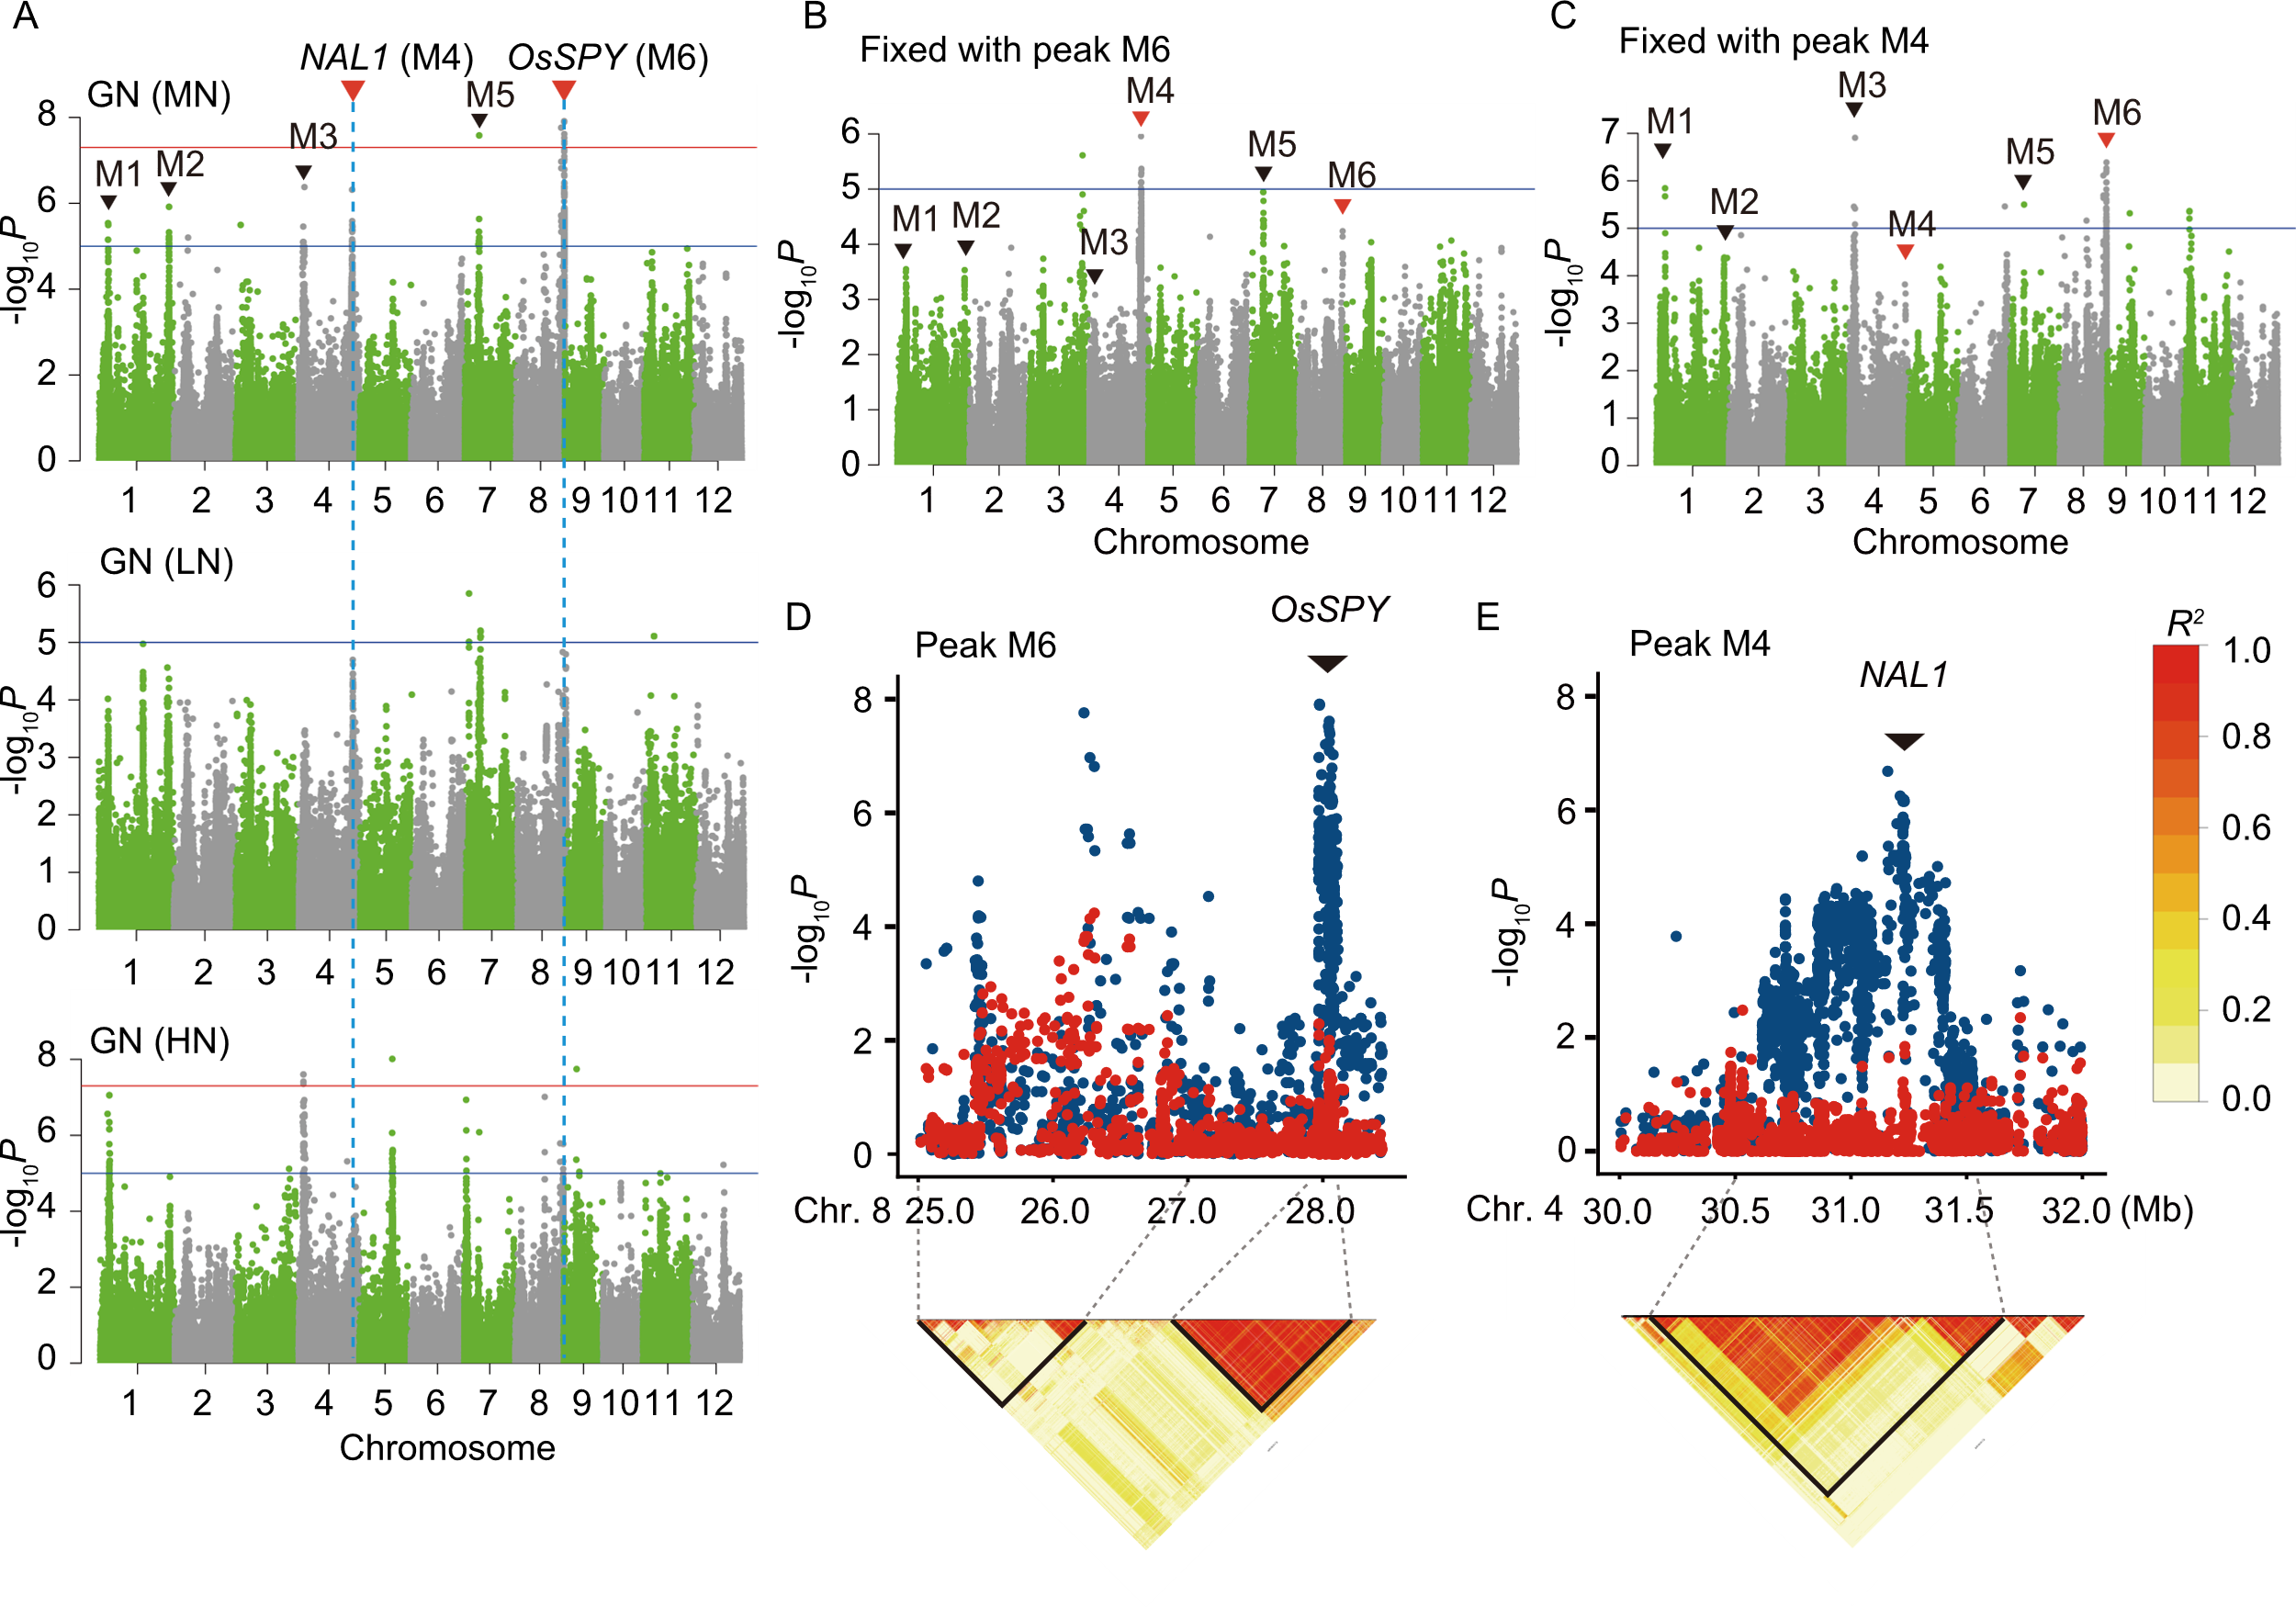
Fig. 2. Genome-wide association analysis (GWAS) for grain number per panicle (GN) under nitrogen conditions. A, Manhattan plot of GWAS for GN under low-, medium-, and high-nitrogen (LN, MN, and HN) conditions. Genome-wide thresholds were set to the significance threshold (P = 5.0e-8; red line) and suggestive threshold (P = 1.0e-5; blue line). M1-M6 represent different peaks. B and C, Manhattan plots of GWAS using the maximum polymorphism of peak M6 (B) and peak M4 (C) as a covariate, respectively. D and E, Local Manhattan plots and linkage disequilibrium (LD) heatmaps for peak M6 on chromosome (Chr.) 8 (D) and peak M4 on Chr. 4 (E). Plots show the results of GWAS performed without (blue dot) or with (red dot) the polymorphism with the highest -log10P within the peak region.
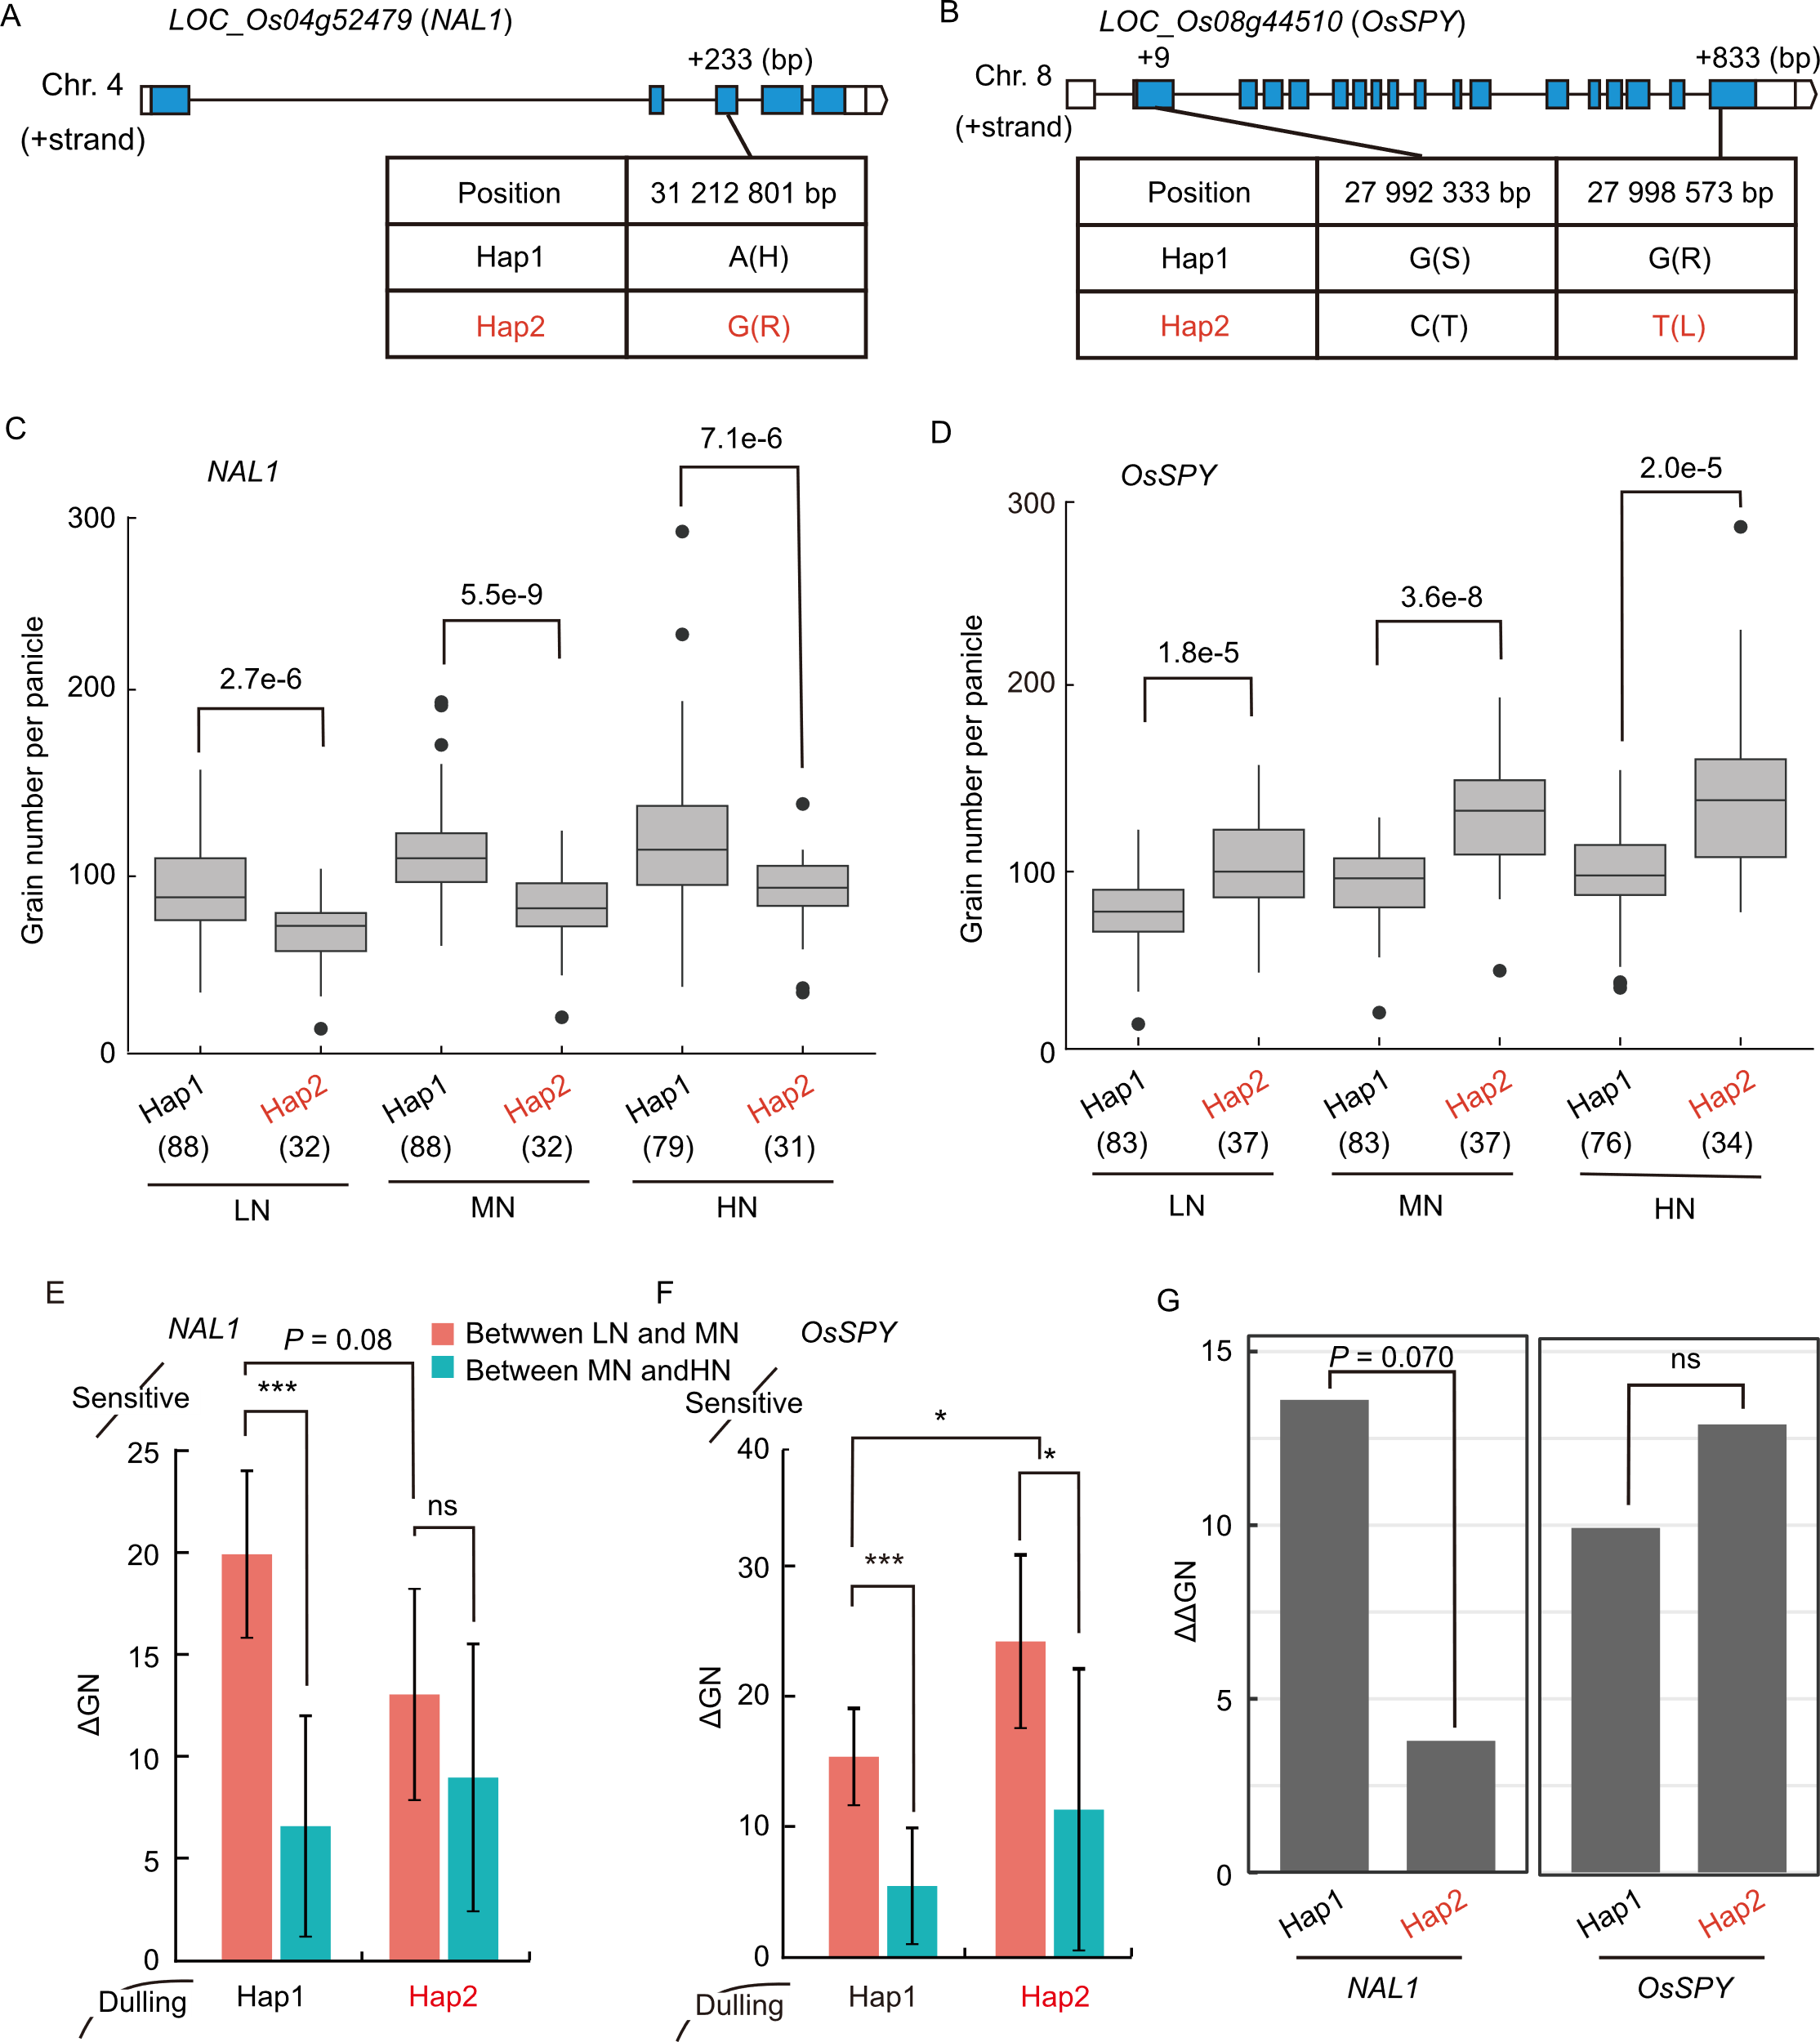
Fig. 3. Nitrogen-dependent changes in effect sizes and phenotypic responses of NAL1 and OsSPY. A and B, Gene structure and DNA polymorphisms of NAL1 (A) and OsSPY (B). Blue boxes, coding sequences, and white boxes represent untranslated regions (UTRs), black lines, and introns, respectively. In the tables, letters outside and inside the parentheses indicate the nucleotide and the corresponding amino acid, respectively. Chr., Chromosome. C and D, Grain number per panicle (GN) under low-, medium-, and high-nitrogen (LN, MN, and HN) conditions for the two haplotypes (Hap) of NAL1 (C) and OsSPY (D). Numbers in parentheses indicate sample sizes. P-values were calculated using Welch’s t-test and corrected by the Bonferroni method. E and F, Changes in GN (ΔGN) between LN and MN and between MN and HN conditions for each haplotype of NAL1 (E) and OsSPY (F). G, Difference between GN responses from LN to MN and from MN to HN for each haplotype of NAL1 and OsSPY, expressed as ΔΔGN [ΔΔGN = (MN − LN) − (HN − MN)]. Positive values indicate that the increase in GN from LN to MN was greater than that from MN to HN, indicating stronger attenuation of nitrogen response under HN conditions. Black indicates the functional haplotype (Hap1), whereas red indicates the weak haplotype (Hap2) and the amino acid substitution associated with reduced activity. In C-F, P-values were calculated using the paired Wilcoxon signed-rank test. Comparisons between haplotypes were performed using Wilcoxon rank-sum tests. Asterisks indicate statistically significant differences (*, P < 0.05; **, P < 0.01; ***, P < 0.001; ns, not significant).
| Condition | Estimate | Pr (Interaction < 0) % | 95% Crl | Rhat |
|---|---|---|---|---|
| HN | -7.76 | 98.3 | [-15.09, -0.51] | 1.00 |
| MN | -4.24 | 95.2 | [-8.95, 0.73] | 1.00 |
| LN | -5.24 | 98.0 | [-10.16, -0.30] | 1.00 |
Table 1. Coefficient for interaction term NAL1 × OsSPY.
| Condition | Estimate | Pr (Interaction < 0) % | 95% Crl | Rhat |
|---|---|---|---|---|
| HN | -7.76 | 98.3 | [-15.09, -0.51] | 1.00 |
| MN | -4.24 | 95.2 | [-8.95, 0.73] | 1.00 |
| LN | -5.24 | 98.0 | [-10.16, -0.30] | 1.00 |
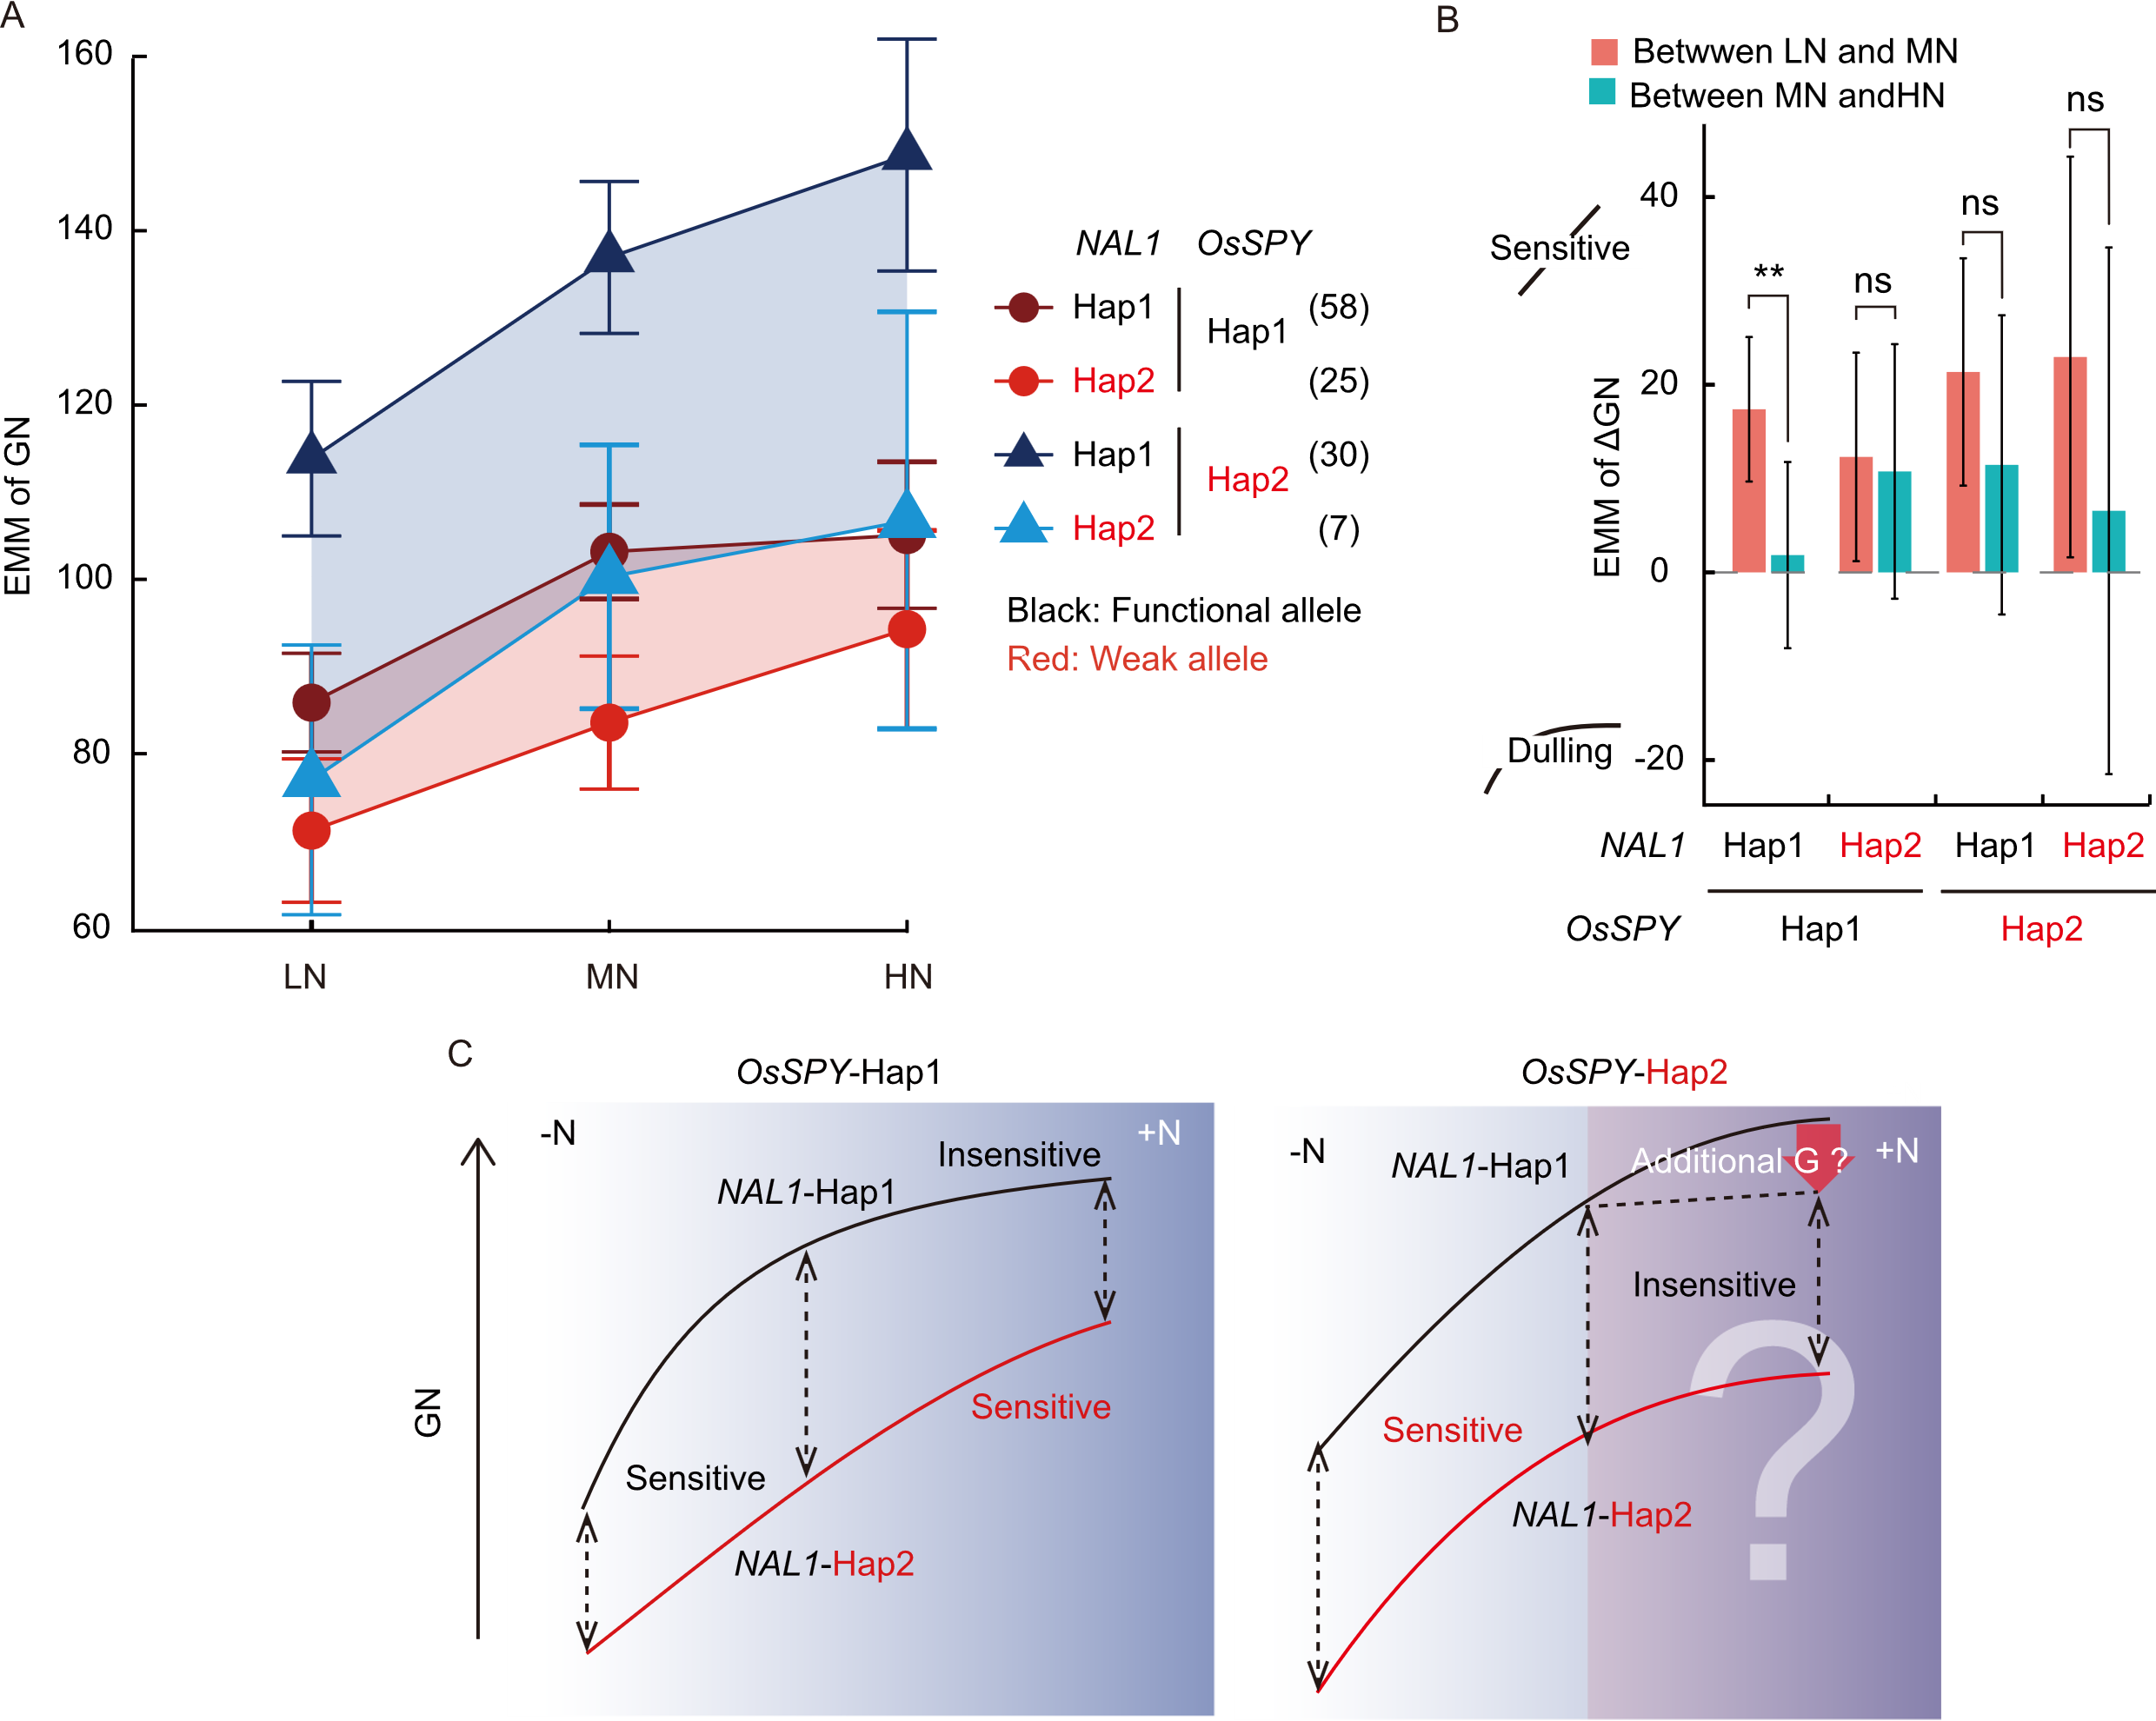
Fig. 4. Genetic interaction between NAL1 and OsSPY under different nitrogen conditions. A, Estimated marginal mean (EMM) of grain number per panicle (GN) for each haplotype combination of NAL1 and OsSPY under low-, medium-, and high-nitrogen (LN, MN, and HN) conditions. Red shaded areas indicate the corresponding differences in EMM between NAL1-Hap1 and NAL1-Hap2 within the OsSPY-Hap1 background, whereas blue shaded areas indicate the corresponding differences in EMM between NAL1-Hap1 and NAL1-Hap2 within the OsSPY-Hap2 background. Error bars represent 95% confidence intervals. Numbers in parentheses in the legend indicate the number of varieties in each haplotype combination. B, Changes in the EMM of GN between LN and MN and between MN and HN conditions for each haplotype combination of NAL1 and OsSPY. Values represent the difference in EMM (ΔGN of EMM) between adjacent nitrogen conditions. Error bars indicate the 95% confidence interval. Asterisks indicate statistically significant differences between LN and MN and between MN and HN conditions within each haplotype combination (**, P < 0.01; ***, P < 0.001; ns, Not significant; P-values were calculated from pairwise contrasts of EMMs using the emmeans package with Kenward-Roger degrees of freedom). C, Schematic model summarizing the relationship between nitrogen responsiveness and the effect of NAL1 in different OsSPY backgrounds. The results suggest that the nitrogen response curve of GN depends on the combination of NAL1 and OsSPY haplotypes, and that the effect of NAL1 becomes stronger in the OsSPY-Hap2 background.
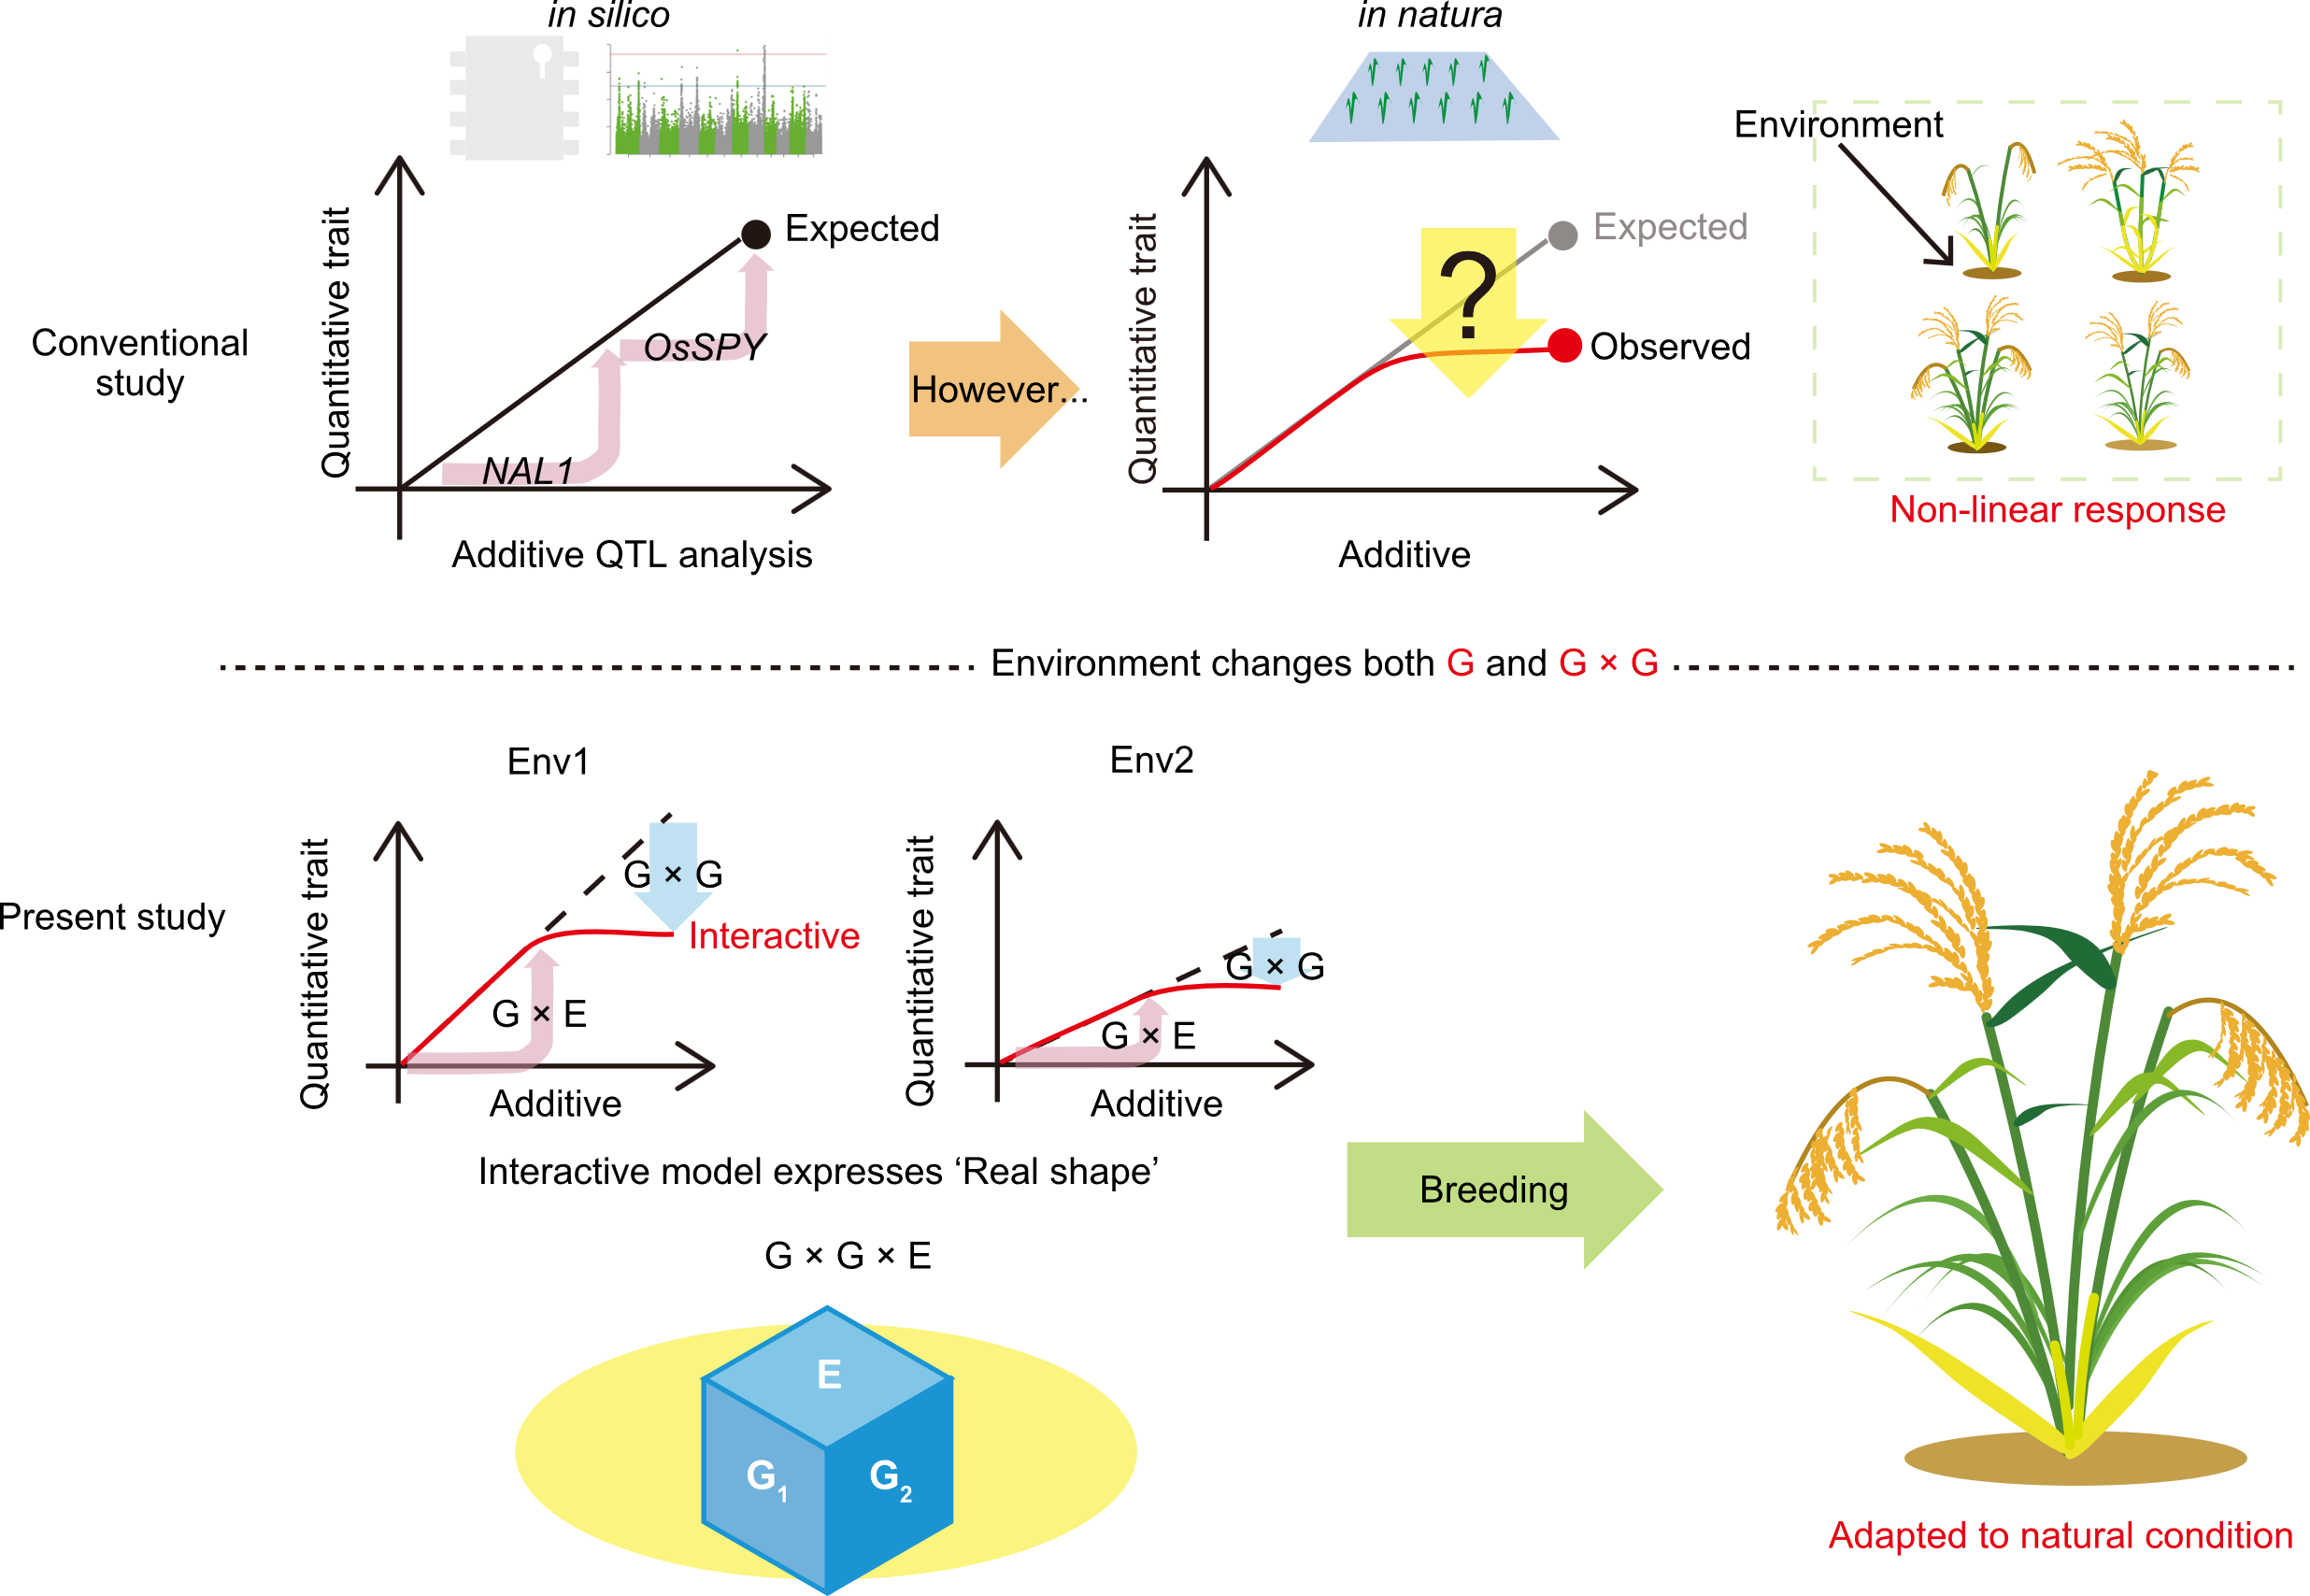
Fig. 5. Limitations of conventional genome-wide association study (GWAS) and potential of gene (G) × G × environment (E)-informed genomic breeding under variable environments. As demonstrated in this study, phenotypes are not determined independently by individual genes or environmental conditions. Rather, they are shaped by the interaction between G and E (Env1, Environment 1; Env2, Environment 2), as well as by the interaction effect among genes (G × G). Therefore, current GWAS has observed only one aspect of the genetic background and has not fully captured its underlying structure. Future analyses should investigate not only the interaction effect among genes but also their interaction with the environment. Such an approach will lead to a deeper understanding of the genetic basis underlying complex traits.
| [1] | Agata A. 2025. Genetic mechanisms underlying diverse panicle architecture in rice. Biosci Biotechnol Biochem, 89(4): 502-507. |
| [2] | Alseekh S, Kostova D, Bulut M, et al. 2021. Genome-wide association studies: Assessing trait characteristics in model and crop plants. Cell Mol Life Sci, 78(15): 5743-5754. |
| [3] | Bürkner P C. 2017. brms: An R package for Bayesian multilevel models using Stan. J Stat Soft, 80(1): 1-28. |
| [4] | Chen B W, Cole J W, Grond-Ginsbach C. 2017. Departure from hardy Weinberg equilibrium and genotyping error. Front Genet, 8: 167. |
| [5] | Chun Y, Kumar A, Li X Y. 2022. Genetic and molecular pathways controlling rice inflorescence architecture. Front Plant Sci, 13: 1010138. |
| [6] | des Marais D L, Hernandez K M, Juenger T E. 2013. Genotype-by-environment interaction and plasticity: Exploring genomic responses of plants to the abiotic environment. Annu Rev Ecol Evol Syst, 44: 5-29. |
| [7] | Ehrenreich I M. 2017. Epistasis: Searching for interacting genetic variants using crosses. Genetics, 206(2): 531-535. |
| [8] | Endelman J B. 2011. Ridge regression and other kernels for genomic selection with R package rrBLUP. Plant Genome, 4: 250-255. |
| [9] | Feng Y, Zhai R R, Lin Z C, et al. 2015. Quantitative trait locus analysis for rice yield traits under two nitrogen levels. Rice Sci, 22(3): 108-115. |
| [10] | Flynn K M, Cooper T F, Moore F B, et al. 2013. The environment affects epistatic interactions to alter the topology of an empirical fitness landscape. PLoS Genet, 9(4): e1003426. |
| [11] | Hamblin M T, Buckler E S, Jannink J L. 2011. Population genetics of genomics-based crop improvement methods. Trends Genet, 27(3): 98-106. |
| [12] | He Z R, Zhao W H, Cheng B P, et al. 2025. Molecular and biological characterization of novel mitovirus infecting phytopathogenic fungus Ustilaginoidea virens. Rice Sci, 32(2): 243-258. |
| [13] | Heslot N, Jannink J L, Sorrells M E. 2015. Perspectives for genomic selection applications and research in plants. Crop Sci, 55(1): 1-12. |
| [14] | Hickey L T, Hafeez A N, Robinson H, et al. 2019. Breeding crops to feed 10 billion. Nat Biotechnol, 37(7): 744-754. |
| [15] | Hu B, Wang W, Chen J J, et al. 2023. Genetic improvement toward nitrogen-use efficiency in rice: Lessons and perspectives. Mol Plant, 16(1): 64-74. |
| [16] | Hu J K, Wang X L, Wang P. 2014. Testing gene-gene interactions in genome wide association studies. Genet Epidemiol, 38(2): 123-134. |
| [17] | Jarquín D, Crossa J, Lacaze X, et al. 2014. A reaction norm model for genomic selection using high-dimensional genomic and environmental data. Theor Appl Genet, 127(3): 595-607. |
| [18] | Kobayashi A, Suganami M, Yoshida H, et al. 2024. How have breeders adapted rice flowering to the growing region? J Integr Plant Biol, 66(12): 2736-2753. |
| [19] | Le Rouzic A, Álvarez-Castro J M. 2008. Estimation of genetic effects and genotype-phenotype maps. Evol Bioinform Online, 4: EBO.S756. |
| [20] | Li P C, Zhuang Z J, Cai H G, et al. 2016. Use of genotype-environment interactions to elucidate the pattern of maize root plasticity to nitrogen deficiency. J Integr Plant Biol, 58(3): 242-253. |
| [21] | Li W J, Yan J J, Zhang Y, et al. 2023. Serine protease NAL1 exerts pleiotropic functions through degradation of TOPLESS-related corepressor in rice. Nat Plants, 9(7): 1130-1142. |
| [22] | Li Z K, Pinson S R M, Park W D, et al. 1997. Epistasis for three grain yield components in rice (Oryza sativa L.). Genetics, 145(2): 453-465. |
| [23] | Liu H J, Yan J B. 2019. Crop genome-wide association study: A harvest of biological relevance. Plant J, 97(1): 8-18. |
| [24] | Liu Q, Wu K, Song W Z, et al. 2022. Improving crop nitrogen use efficiency toward sustainable green revolution. Annu Rev Plant Biol, 73: 523-551. |
| [25] | Luo L, Zhang Y L, Xu G H. 2020. How does nitrogen shape plant architecture? J Exp Bot, 71(15): 4415-4427. |
| [26] | McFarquhar M. 2016. Testable hypotheses for unbalanced neuroimaging data. Front Neurosci, 10: 270. |
| [27] | Pecanka J, Jonker M A, International Parkinson’S Disease Genomics Consortium (IPDGC), et al. 2017. A powerful and efficient two-stage method for detecting gene-to-gene interactions in GWAS. Biostatistics, 18(3): 477-494. |
| [28] | R Core Team. 2023. R: A Language and Environment for Statistical Computing. Vienna, Austria: R Foundation for statistical Computing. https://www.R-project.org/. |
| [29] | Segura V, Vilhjálmsson B J, Platt A, et al. 2012. An efficient multi-locus mixed-model approach for genome-wide association studies in structured populations. Nat Genet, 44(7): 825-830. |
| [30] | Senthilvel S, Vinod K K, Malarvizhi P, et al. 2008. QTL and QTL × environment effects on agronomic and nitrogen acquisition traits in rice. J Integr Plant Biol, 50(9): 1108-1117. |
| [31] | Suganami M, Kojima S, Wang F M, et al. 2023. Effective use of legacy data in a genome-wide association studies improves the credibility of quantitative trait loci detection in rice. Plant Physiol, 191(3): 1561-1573. |
| [32] | Suganami M, Yoshida H, Yoshida S, et al. 2024. Redefining awn development in rice through the breeding history of Japanese awn reduction. Front Plant Sci, 15: 1370956. |
| [33] | Takai T, Adachi S, Taguchi-Shiobara F, et al. 2013. A natural variant of NAL1, selected in high-yield rice breeding programs, pleiotropically increases photosynthesis rate. Sci Rep, 3: 2149. |
| [34] | Tong H H, Chen L, Li W P, et al. 2011. Identification and characterization of quantitative trait loci for grain yield and its components under different nitrogen fertilization levels in rice (Oryza sativa L.). Mol Breed, 28(4): 495-509. |
| [35] | Wang F M, Yoshida H, Matsuoka M. 2021. Making the ‘Green Revolution’ truly green: Improving crop nitrogen use efficiency. Plant Cell Physiol, 62(6): 942-947. |
| [36] | Wittke-Thompson J K, Pluzhnikov A, Cox N J. 2005. Rational inferences about departures from Hardy-Weinberg equilibrium. Am J Hum Genet, 76(6): 967-986. |
| [37] | Yadav S, Sandhu N, Majumder R R, et al. 2019. Epistatic interactions of major effect drought QTLs with genetic background loci determine grain yield of rice under drought stress. Sci Rep, 9(1): 2616. |
| [38] | Yano K, Morinaka Y, Wang F M, et al. 2019. GWAS with principal component analysis identifies a gene comprehensively controlling rice architecture. Proc Natl Acad Sci USA, 116(42): 21262-21267. |
| [39] | Yoshida H, Itoh H, Mori M, et al. 2025. Photoperiodic flowering regulators are required for nitrogen-dependent flowering delay in rice under long-day condition. Nat Commun, 16: 9231. |
| [40] | Yu J M, Pressoir G, Briggs W H, et al. 2006. A unified mixed-model method for association mapping that accounts for multiple levels of relatedness. Nat Genet, 38(2): 203-208. |
| [41] | Zan Y J, Carlborg Ö. 2020. Dynamic genetic architecture of yeast response to environmental perturbation shed light on origin of cryptic genetic variation. PLoS Genet, 16(5): e1008801. |
| [42] | Zhai R R, Li Z, Xiang Y Y, et al. 2025. OsNAC022 controls tiller number through mediating CCA1 expression in rice. Rice Sci, 32(4): 445-448. |
| [43] | Zheng X, Levine D, Shen J, et al. 2012. A high-performance computing toolset for relatedness and principal component analysis of SNP data. Bioinformatics, 28(24): 3326-3328. |
| [44] | Ziyatdinov A, Vázquez-Santiago M, Brunel H, et al. 2018. lme4qtl: Linear mixed models with flexible covariance structure for genetic studies of related individuals. BMC Bioinformatics, 19(1): 68. |
| [1] | Li Haifeng, Qin Hua. Molecular Mechanism in Regulation of Rice Tiller Development [J]. Rice Science, 2026, 33(4): 485-498. |
| [2] | Chu Qingnan, Li Detian, Feng Zhihang, Wang Mengcen, Sha Zhimin. Breeding Rice to Recruit Diazotrophs: Plant Genetic Levers for Rhizosphere Nitrogen Fixation [J]. Rice Science, 2026, 33(4): 465-484. |
| [3] | Nairiane dos Santos Bilhalva, Paulo Carteri Coradi, Rosana Santos de Moraes, Dthenifer Cordeiro Santana, Larissa Ribeiro Teodoro, Paulo Eduardo Teodoro, Marisa Menezes Leal. Physical and Physicochemical Classification of Parboiled Rice Using VNIR-SWIR Spectroscopy and Machine Learning [J]. Rice Science, 2025, 32(6): 857-867. |
| [4] | Zhou Lin, Jiang Hong, Huang Long, Li Ziang, Yao Zhonghao, Li Linhan, Ji Kangwei, Li Yijie, Tang Haijuan, Cheng Jinping, Bao Yongmei, Huang Ji, Zhang Hongsheng, Chen Sunlu. Genome-Wide Association Study of Brown Rice Weight Identifies an RNA-Binding Protein Antagonistically Regulating Grain Weight and Panicle Number [J]. Rice Science, 2025, 32(4): 525-536. |
| [5] | Ratan Kumar Ganapati, Chen Kai, Zhao Xiuqin, Zheng Tianqing, Zhang Fan, Zhai Laiyuan, Xu Jianlong. Genome-Wide Association Study and Haplotype Analysis Jointly Identify New Candidate Genes for Alkaline Tolerance at Seedling Stage in Rice [J]. Rice Science, 2025, 32(4): 537-548. |
| [6] | Ren Jian, Hu Kelin, Feng Puyu, William D. Batchelor, Liu Haitao, Lü Shihua. Simulating Responses of Rice Yield and Nitrogen Fates to Ground Cover Rice Production System under Different Types of Precipitation Years [J]. Rice Science, 2024, 31(6): 725-739. |
| [7] | Zhang Youliang, Zhu Kaican, Tang Yongqi, Feng Shaoyuan. Rice Cultivation under Film Mulching Can Improve Soil Environment and Be Beneficial for Rice Production in China [J]. Rice Science, 2024, 31(5): 545-555. |
| [8] | Hu Yunchao, Yan Tiancai, Gao Zhenyu, Wang Tiankang, Lu Xueli, Yang Long, Shen Lan, Zhang Qiang, Hu Jiang, Ren Deyong, Zhang Guangheng, Zhu Li, Li Li, Zeng Dali, Qian Qian, Li Qing. Appropriate Supply of Ammonium Nitrogen and Ammonium Nitrate Reduces Cadmium Content in Rice Seedlings by Inhibiting Cadmium Uptake and Transport [J]. Rice Science, 2024, 31(5): 587-602. |
| [9] | Deng Bowen, Zhang Yanni, Zhang Fan, Wang Wensheng, Xu Jianlong, Zhang Yu, Bao Jinsong. Genome-Wide Association Study of Cooked Rice Textural Attributes and Starch Physicochemical Properties in indica Rice [J]. Rice Science, 2024, 31(3): 300-316. |
| [10] | Di Dongwei, Ma Mingkun, Zhang Xiaoyang, Lu Yufang, Herbert J. Kronzucker, Shi Weiming. Potential Secretory Transporters and Biosynthetic Precursors of Biological Nitrification Inhibitor 1,9-Decanediol in Rice as Revealed by Transcriptome and Metabolome Analyses [J]. Rice Science, 2024, 31(1): 87-102. |
| [11] | Ji Dongling, Xiao Wenhui, Sun Zhiwei, Liu Lijun, Gu Junfei, Zhang Hao, Matthew Tom Harrison, Liu Ke, Wang Zhiqin, Wang Weilu. Translocation and Distribution of Carbon-Nitrogen in Relation to Rice Yield and Grain Quality as Affected by High Temperature at Early Panicle Initiation Stage [J]. Rice Science, 2023, 30(6): 598-612. |
| [12] | Sheikh Faruk Ahmed, Hayat Ullah, May Zun Aung, Rujira Tisarum, Suriyan Cha-Um, Avishek Datta. Iron Toxicity Tolerance of Rice Genotypes in Relation to Growth, Yield and Physiochemical Characters [J]. Rice Science, 2023, 30(4): 321-334. |
| [13] | Jiang Hongzhen, Wang Yamei, Lai Liuru, Liu Xintong, Miao Changjian, Liu Ruifang, Li Xiaoyun, Tan Jinfang, Gao Zhenyu, Chen Jingguang. OsAMT1.1 Expression by Nitrate-Inducible Promoter of OsNAR2.1 Increases Nitrogen Use Efficiency and Rice Yield [J]. Rice Science, 2023, 30(3): 222-234. |
| [14] | Qiu Diyang, Hu Rui, Li Ji, Li Ying, Ding Jierong, Xia Kuaifei, Zhong Xuhua, Fang Zhongming, Zhang Mingyong. Peptide Transporter OsNPF8.1 Contributes to Sustainable Growth under Salt and Drought Stresses, and Grain Yield under Nitrogen Deficiency in Rice [J]. Rice Science, 2023, 30(2): 113-126. |
| [15] | Amrit Kumar Nayak, Anilkumar C, Sasmita Behera, Rameswar Prasad Sah, Gera Roopa Lavanya, Awadhesh Kumar, Lambodar Behera, Muhammed Azharudheen Tp. Genetic Dissection of Grain Size Traits Through Genome-Wide Association Study Based on Genic Markers in Rice [J]. Rice Science, 2022, 29(5): 462-472. |
| Viewed | ||||||
|
Full text |
|
|||||
|
Abstract |
|
|||||
