Rice Science ›› 2025, Vol. 32 ›› Issue (6): 845-856.DOI: 10.1016/j.rsci.2025.09.001
• Research Papers • Previous Articles Next Articles
Fazli Hameed1, Shah Fahad Rahim2, Anis Ur Rehman Khalil5, Ram L. Ray3, Xu Junzeng2( ), Alhaj Yousef Hamoud2, Akhtar Ali4, Ning Tangyuan1()
Received:2025-05-06
Accepted:2025-07-20
Online:2025-11-28
Published:2025-12-04
Contact:
Ning Tangyuan (Fazli Hameed, Shah Fahad Rahim, Anis Ur Rehman Khalil, Ram L. Ray, Xu Junzeng, Alhaj Yousef Hamoud, Akhtar Ali, Ning Tangyuan. Comparing Genotype and Climate Change Effects on Simulated Historical Rice Yields Using AquaCrop[J]. Rice Science, 2025, 32(6): 845-856.
Add to citation manager EndNote|Ris|BibTeX
| Parameter | 1979 (V1) | 1988 (V2) | 2000 (V3) |
|---|---|---|---|
| Base temperature (ºC) | 8 | 8 | 8 |
| Upper temperature (ºC) | 30 | 30 | 30 |
| Soil water depletion factor for canopy expansion: Lower threshold | 0.60 | 0.55 | 0.55 |
| Crop coefficient | 1.15 | 1.15 | 1.25 |
| Number of plants per hectare | 206 667 | 205 761 | 206 667 |
| Coefficient for canopy growth | 0.133 | 0.133 | 0.132 |
| Coefficient for canopy decline (in fraction per day) | 0.038 | 0.038 | 0.038 |
| Maximum canopy cover in fraction soil cover | 0.99 | 0.98 | 0.95 |
| Days from transplanting to maximum canopy cover (d) | 52 | 52 | 50 |
| Days from transplanting to recovery (d) | 7 | 7 | 5 |
| Days from transplanting to maximum rooting depth (d) | 61 | 61 | 59 |
| Days from transplanting to senescence (d) | 79 | 85 | 92 |
| Days from transplanting to maturity (d) | 125 | 115 | 115 |
| Days from transplanting to flowering (d) | 65 | 67 | 63 |
| Flowering duration (d) | 13 | 12 | 15 |
| Water productivity normalized for evapotranspiration and CO2 (g/m2) | 16.5 | 18.0 | 18.0 |
| Reference harvest index in percent (%) | 41 | 43 | 41 |
Table 1. Parameters calibrated for growing seasons of 1979, 1988, and 2000.
| Parameter | 1979 (V1) | 1988 (V2) | 2000 (V3) |
|---|---|---|---|
| Base temperature (ºC) | 8 | 8 | 8 |
| Upper temperature (ºC) | 30 | 30 | 30 |
| Soil water depletion factor for canopy expansion: Lower threshold | 0.60 | 0.55 | 0.55 |
| Crop coefficient | 1.15 | 1.15 | 1.25 |
| Number of plants per hectare | 206 667 | 205 761 | 206 667 |
| Coefficient for canopy growth | 0.133 | 0.133 | 0.132 |
| Coefficient for canopy decline (in fraction per day) | 0.038 | 0.038 | 0.038 |
| Maximum canopy cover in fraction soil cover | 0.99 | 0.98 | 0.95 |
| Days from transplanting to maximum canopy cover (d) | 52 | 52 | 50 |
| Days from transplanting to recovery (d) | 7 | 7 | 5 |
| Days from transplanting to maximum rooting depth (d) | 61 | 61 | 59 |
| Days from transplanting to senescence (d) | 79 | 85 | 92 |
| Days from transplanting to maturity (d) | 125 | 115 | 115 |
| Days from transplanting to flowering (d) | 65 | 67 | 63 |
| Flowering duration (d) | 13 | 12 | 15 |
| Water productivity normalized for evapotranspiration and CO2 (g/m2) | 16.5 | 18.0 | 18.0 |
| Reference harvest index in percent (%) | 41 | 43 | 41 |
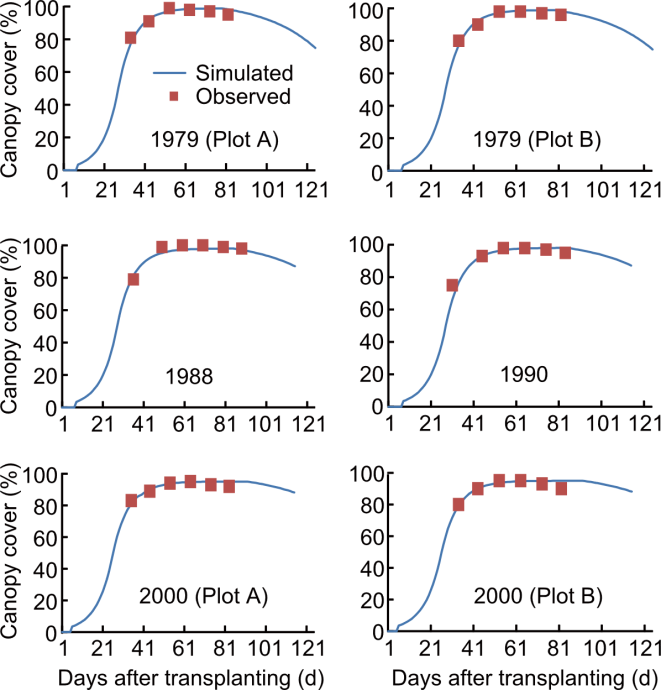
Fig. 1. Calibration and validation of canopy cover for growing seasons of 1979 (Plot A), 1979 (Plot B), 1988, 1990, 2000 (Plot A), and 2000 (Plot B).
| Parameter | Biomass (t/hm2) | Canopy cover (%) | Surface water (mm) | Biomass (t/hm2) | Canopy cover (%) | Surface water (mm) | Biomass (t/hm2) | Canopy cover (%) | Surface water (mm) | ||
|---|---|---|---|---|---|---|---|---|---|---|---|
| 1979 (Plot A) | 1988 | 2000 (Plot A) | |||||||||
| Calibration | |||||||||||
| Pearson ® | 0.99 | 0.97 | 0.81 | 0.99 | 0.99 | 0.88 | 0.99 | 0.96 | 0.91 | ||
| RMSE | 0.63 | 2.40 | 15.21 | 0.54 | 2.40 | 8.53 | 0.91 | 1.70 | 12.71 | ||
| RMSEn (%) | 7.40 | 2.60 | 20.50 | 7.30 | 2.50 | 22.63 | 9.80 | 1.90 | 26.50 | ||
| Model efficiency | 0.97 | 0.85 | 0.61 | 0.99 | 0.90 | 0.69 | 0.98 | 0.82 | 0.74 | ||
| Agreement index | 0.99 | 0.97 | 0.88 | 1.00 | 0.97 | 0.93 | 0.99 | 0.96 | 0.94 | ||
| Average observed | 8.52 | 0.94 | 79.37 | 7.45 | 0.96 | 37.68 | 9.24 | 0.91 | 47.92 | ||
| Average simulated | 8.12 | 0.94 | 74.07 | 7.64 | 0.95 | 35.86 | 9.18 | 0.92 | 42.80 | ||
| 1979 (Plot B) | 1990 | 2000 (Plot B) | |||||||||
| Validation | |||||||||||
| Pearson ® | 1.00 | 0.98 | 0.74 | 1.00 | 0.99 | 0.76 | 0.99 | 0.93 | 0.76 | ||
| RMSE | 0.76 | 2.00 | 17.60 | 1.13 | 3.90 | 14.13 | 0.99 | 2.30 | 12.50 | ||
| RMSEn (%) | 9.10 | 2.10 | 18.96 | 15.30 | 4.20 | 20.17 | 10.90 | 2.50 | 52.28 | ||
| Model efficiency | 0.96 | 0.91 | 0.48 | 0.94 | 0.76 | 0.58 | 0.97 | 0.80 | 0.72 | ||
| Agreement index | 0.99 | 0.98 | 0.86 | 0.99 | 0.96 | 0.85 | 0.99 | 0.95 | 0.89 | ||
| Average observed | 8.36 | 93.20 | 92.80 | 7.38 | 92.70 | 70.09 | 9.04 | 90.50 | 25.94 | ||
| Average simulated | 7.63 | 93.70 | 92.46 | 6.34 | 91.50 | 72.24 | 8.68 | 91.30 | 22.11 | ||
Table 2. Calibration of years 1979 (Plot A), 1988, and 2000 (Plot A), and validation of years 1979 (Plot B), 1990, and 2000 (Plot B).
| Parameter | Biomass (t/hm2) | Canopy cover (%) | Surface water (mm) | Biomass (t/hm2) | Canopy cover (%) | Surface water (mm) | Biomass (t/hm2) | Canopy cover (%) | Surface water (mm) | ||
|---|---|---|---|---|---|---|---|---|---|---|---|
| 1979 (Plot A) | 1988 | 2000 (Plot A) | |||||||||
| Calibration | |||||||||||
| Pearson ® | 0.99 | 0.97 | 0.81 | 0.99 | 0.99 | 0.88 | 0.99 | 0.96 | 0.91 | ||
| RMSE | 0.63 | 2.40 | 15.21 | 0.54 | 2.40 | 8.53 | 0.91 | 1.70 | 12.71 | ||
| RMSEn (%) | 7.40 | 2.60 | 20.50 | 7.30 | 2.50 | 22.63 | 9.80 | 1.90 | 26.50 | ||
| Model efficiency | 0.97 | 0.85 | 0.61 | 0.99 | 0.90 | 0.69 | 0.98 | 0.82 | 0.74 | ||
| Agreement index | 0.99 | 0.97 | 0.88 | 1.00 | 0.97 | 0.93 | 0.99 | 0.96 | 0.94 | ||
| Average observed | 8.52 | 0.94 | 79.37 | 7.45 | 0.96 | 37.68 | 9.24 | 0.91 | 47.92 | ||
| Average simulated | 8.12 | 0.94 | 74.07 | 7.64 | 0.95 | 35.86 | 9.18 | 0.92 | 42.80 | ||
| 1979 (Plot B) | 1990 | 2000 (Plot B) | |||||||||
| Validation | |||||||||||
| Pearson ® | 1.00 | 0.98 | 0.74 | 1.00 | 0.99 | 0.76 | 0.99 | 0.93 | 0.76 | ||
| RMSE | 0.76 | 2.00 | 17.60 | 1.13 | 3.90 | 14.13 | 0.99 | 2.30 | 12.50 | ||
| RMSEn (%) | 9.10 | 2.10 | 18.96 | 15.30 | 4.20 | 20.17 | 10.90 | 2.50 | 52.28 | ||
| Model efficiency | 0.96 | 0.91 | 0.48 | 0.94 | 0.76 | 0.58 | 0.97 | 0.80 | 0.72 | ||
| Agreement index | 0.99 | 0.98 | 0.86 | 0.99 | 0.96 | 0.85 | 0.99 | 0.95 | 0.89 | ||
| Average observed | 8.36 | 93.20 | 92.80 | 7.38 | 92.70 | 70.09 | 9.04 | 90.50 | 25.94 | ||
| Average simulated | 7.63 | 93.70 | 92.46 | 6.34 | 91.50 | 72.24 | 8.68 | 91.30 | 22.11 | ||
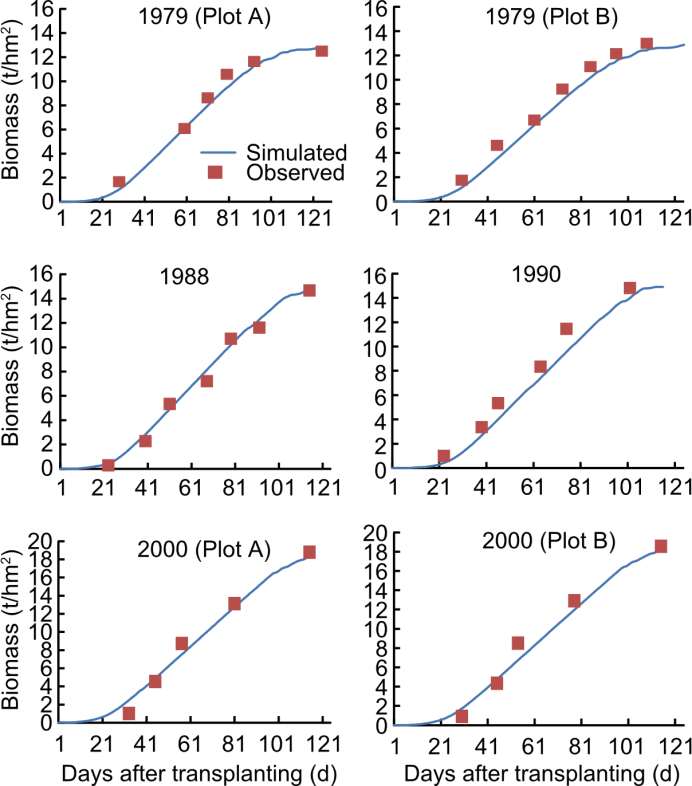
Fig. 2. Calibration and validation of above-ground biomass for growing seasons of 1979 (Plot A), 1979 (Plot B), 1988, 1990, 2000 (Plot A), and 2000 (Plot B).
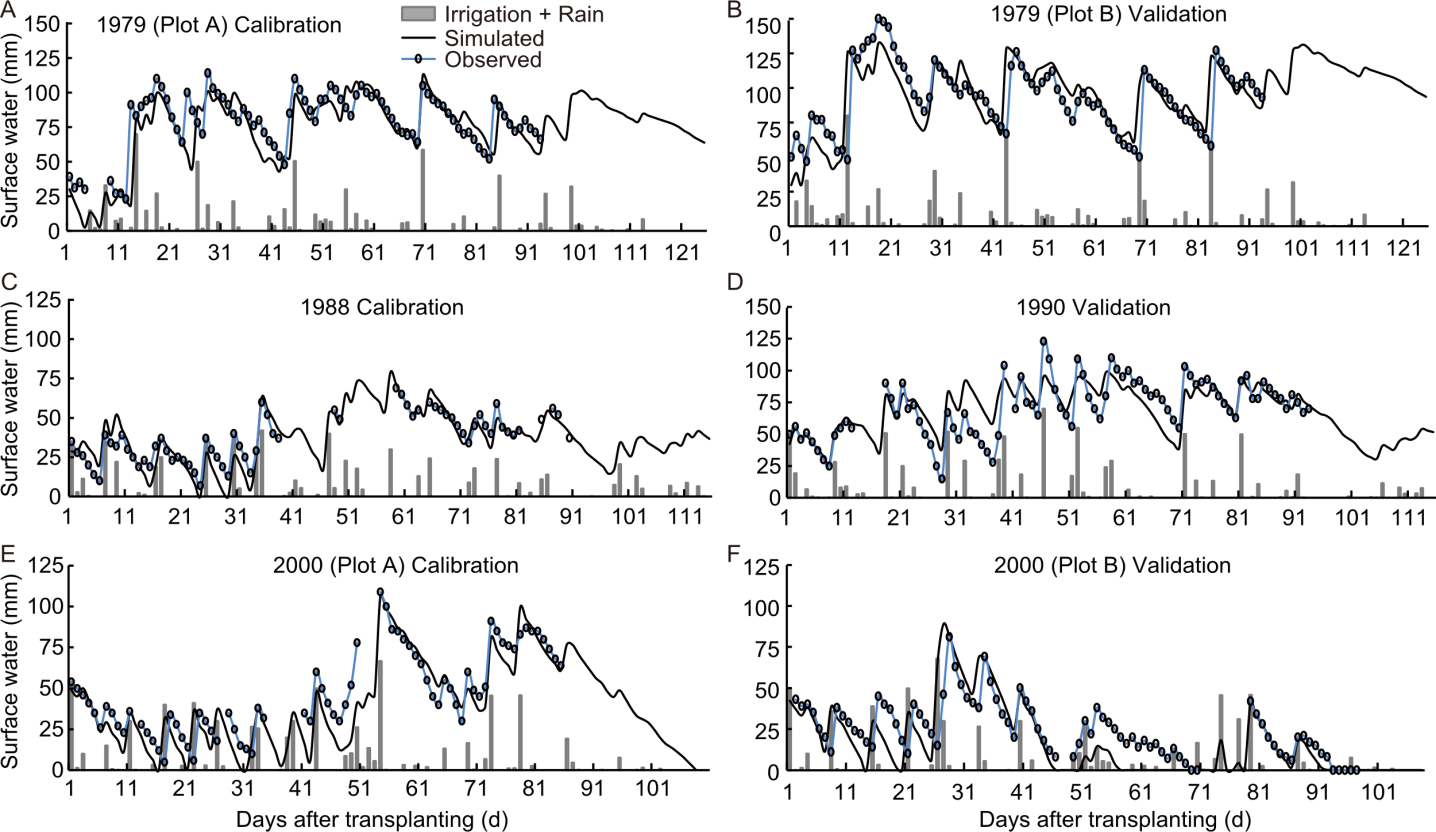
Fig. 3. Calibration and validation of surface water for 1979 (A and B), 1988 (C), 1990 (D), and 2000 (E and F).
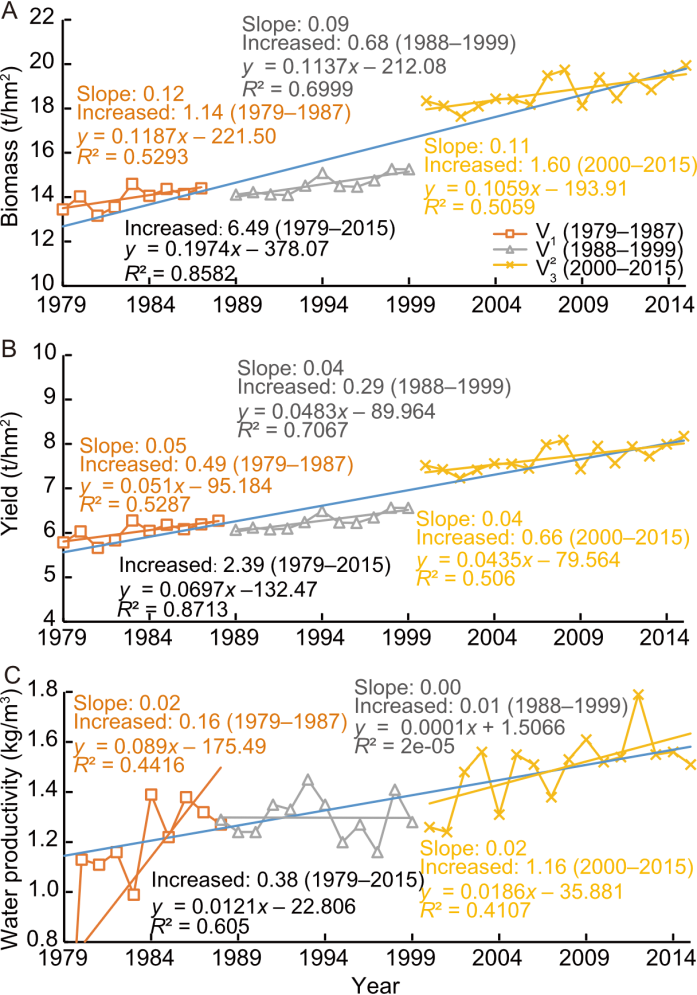
Fig. 4. Trends in above-ground biomass (A), grain yield (B), and water productivity (C) from 1979 to 2015 under continuous flooding irrigation.
| Variety | Parameter | Total change | Climate change | Percentage of climate change (%) | Variety change | Percentage of variety change (%) |
|---|---|---|---|---|---|---|
| V3‒V1 | Biomass (t/hm2) | 5.65 | 3.43 | 61.00 | 2.22 | 39.33 |
| Grain yield (t/hm2) | 2.49 | 1.43 | 57.57 | 1.06 | 42.43 | |
| WPet (kg/m3) | 0.55 | 0.41 | 75.58 | 0.13 | 24.42 | |
| V3‒V2 | Biomass (t/hm2) | 4.85 | 2.58 | 53.23 | 2.27 | 46.77 |
| Grain yield (t/hm2) | 1.67 | 1.08 | 64.32 | 0.60 | 35.68 | |
| WPet (kg/m3) | 0.28 | 0.27 | 94.48 | 0.02 | 5.52 |
Table 3. Bifurcation of climate and variety contributions in biomass, grain yield, and water productivity (WPet).
| Variety | Parameter | Total change | Climate change | Percentage of climate change (%) | Variety change | Percentage of variety change (%) |
|---|---|---|---|---|---|---|
| V3‒V1 | Biomass (t/hm2) | 5.65 | 3.43 | 61.00 | 2.22 | 39.33 |
| Grain yield (t/hm2) | 2.49 | 1.43 | 57.57 | 1.06 | 42.43 | |
| WPet (kg/m3) | 0.55 | 0.41 | 75.58 | 0.13 | 24.42 | |
| V3‒V2 | Biomass (t/hm2) | 4.85 | 2.58 | 53.23 | 2.27 | 46.77 |
| Grain yield (t/hm2) | 1.67 | 1.08 | 64.32 | 0.60 | 35.68 | |
| WPet (kg/m3) | 0.28 | 0.27 | 94.48 | 0.02 | 5.52 |
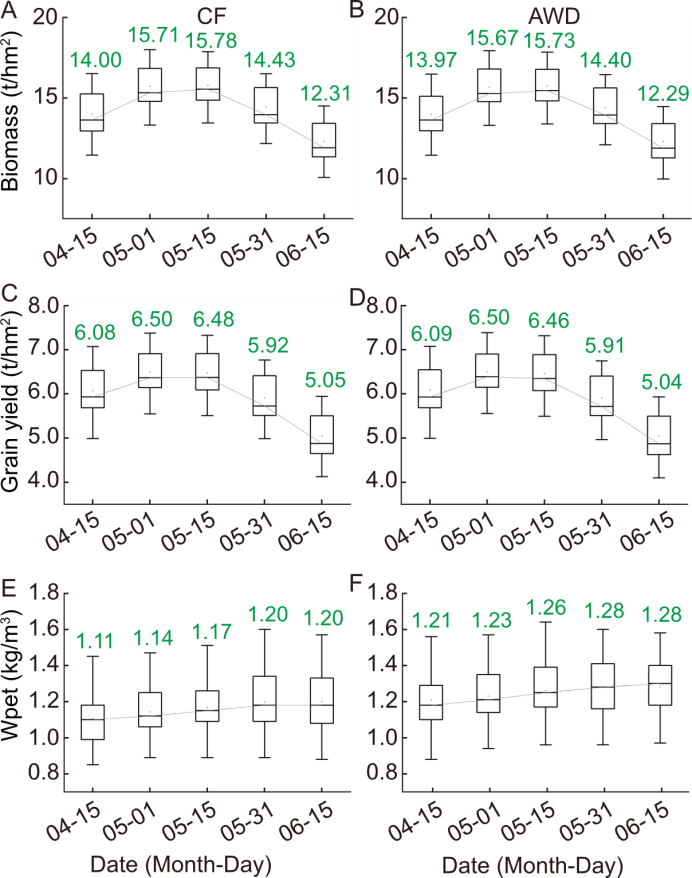
Fig. 5. Performance of variety V1 under continuous flooding (CF) (A, C, and E) and alternate wetting and drying (AWD) (B, D, and F) conditions at five transplanting dates. Biomass, grain yield, and water productivity (WPet) are shown as boxplots to compare irrigation and timing effects.
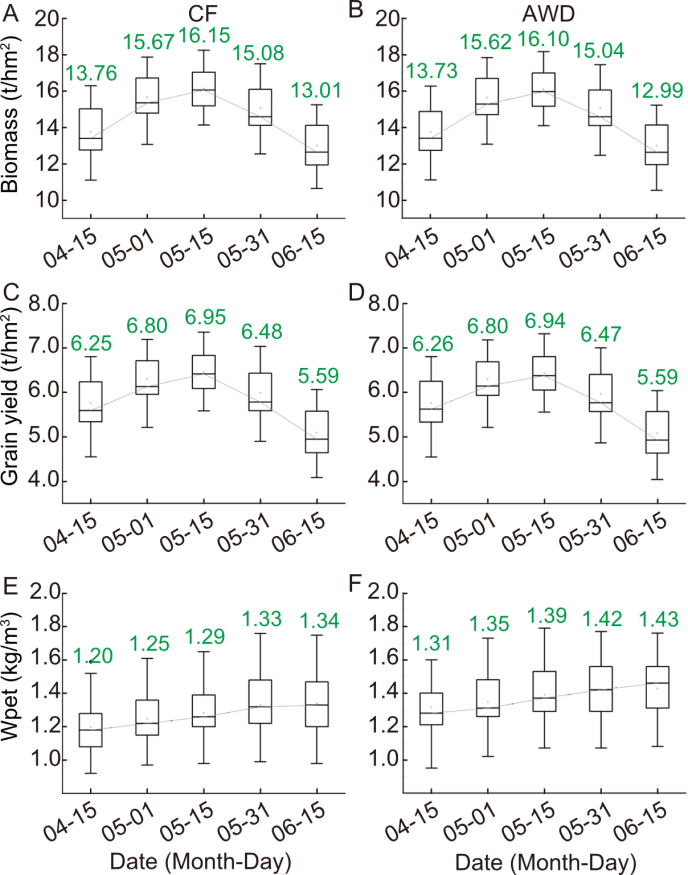
Fig. 6. Performance of variety V2 under continuous flooding (CF) (A, C, and E) and alternate wetting and drying (AWD) (B, D, and F) conditions at five transplanting dates. Biomass, grain yield, and water productivity (WPet) are shown as boxplots to compare irrigation and timing effects.
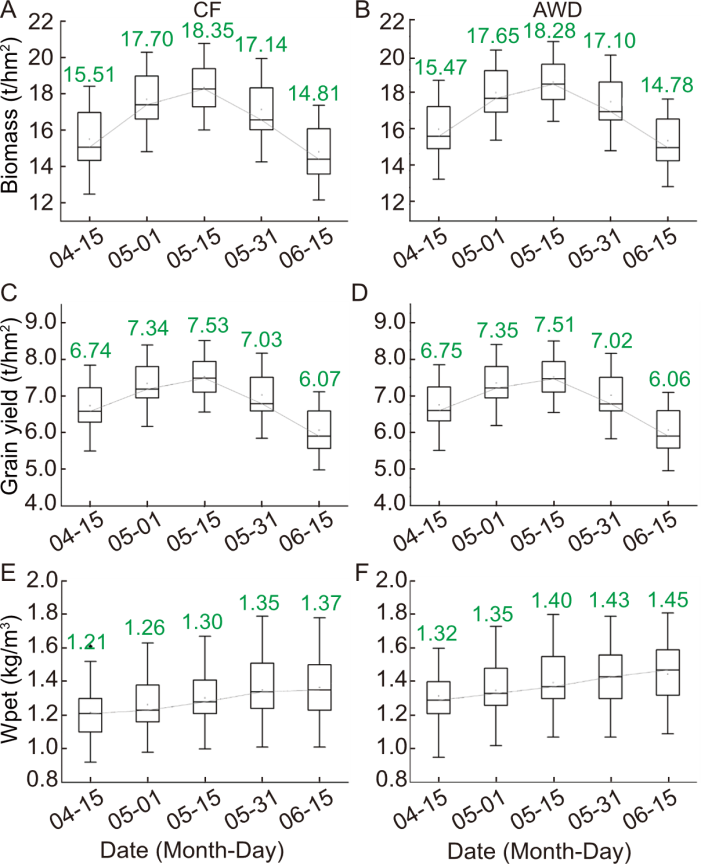
Fig. 7. Performance of variety V3 under continuous flooding (CF) (A, C, and E) and alternate wetting and drying (AWD) (B, D, and F) conditions at five transplanting dates. Biomass, grain yield, and water productivity (WPet) are shown as boxplots to compare irrigation and timing effects.
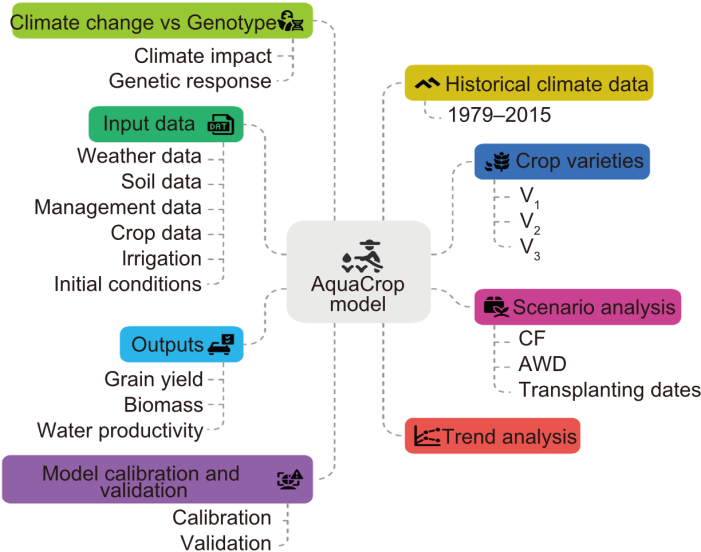
Fig. 8. Schematic diagram of AquaCrop model. CF, Continuous flooding; AWD, Alternate wetting and drying.
| [1] | Abdalhi M A M, Jia Z H. 2018. Crop yield and water saving potential for AquaCrop model under full and deficit irrigation managements. Ital J Agron, 13(4): 1288. |
| [2] | Abid M, Khan I, Mahmood F, et al. 2015. Response of hybrid rice to various transplanting dates and nitrogen application rates. Philipp Agric Sci, 98(1): 98-104. |
| [3] | Ahmadzadeh Araji H, Wayayok A, Khayamim S, et al. 2019. Calibration of the aquacrop model to simulate sugar beet production and water productivity under different treatments. Appl Eng Agric, 35(2): 211-219. |
| [4] | Alhaj Hamoud Y, Shaghaleh H, Sheteiwy M, et al. 2019. Impact of alternative wetting and soil drying and soil clay content on the morphological and physiological traits of rice roots and their relationships to yield and nutrient use-efficiency. Agric Water Manag, 223: 105706. |
| [5] | Allen R G, Pereira L S, Raes D, et al. 1998. Crop Evapotranspiration: Guidelines for Computing Crop Water Requirements. Irrigation and Drainage Paper 56. Rome: FAO. |
| [6] | Amiri E. 2016. Calibration and testing of the Aquacrop model for rice under water and nitrogen management. Commun Soil Sci Plant Anal, 47(3): 387-403. |
| [7] | Amiri E, Rezaei M, Rezaei E E, et al. 2014. Evaluation of CERES-Rice, AquaCrop and ORYZA2000 models in simulation of rice yield response to different irrigation and nitrogen management strategies. J Plant Nutr, 37(11): 1749-1769. |
| [8] | Araji H A, Wayayok A, Bavani A M, et al. 2018. Impacts of climate change on soybean production under different treatments of field experiments considering the uncertainty of general circulation models. Agric Water Manag, 205: 63-71. |
| [9] | Araya A, Keesstra S D, Stroosnijder L. 2010. Simulating yield response to water of Teff (Eragrostis tef) with FAO’s AquaCrop model. Field Crops Res, 116(1/2): 196-204. |
| [10] | Arif C, Setiawan B I, Sofiyuddin H A, et al. 2012. Estimating crop coefficient in intermittent irrigation paddy fields using Excel solver. Rice Sci, 19(2): 143-152. |
| [11] | Change O C. 2007. Intergovernmental panel on climate change. World Meteorol Organ, 52: 1. |
| [12] | Datta A, Ullah H, Ferdous Z. 2017. Water management in rice. In: Rice Production Worldwide. Cham: Springer International Publishing: 255-277. |
| [13] | Ebrahim A, Hamidreza A A, Aimrun W, et al. 2015. Simulation of rice yield under water and salinity stress in Rasht area using AquaCrop model. J Teknol: Sci Eng, 76(15): 21-28. |
| [14] | Farooq M S, Gyilbag A, Virk A L, et al, 2021. Adaptability mechanisms of japonica rice based on the comparative temperature conditions of Harbin and Qiqihar, Heilongjiang Province of Northeast China. Agronomy, 11(11): 2367. |
| [15] | Greaves G E, Wang Y M. 2016. Assessment of FAO AquaCrop model for simulating maize growth and productivity under deficit irrigation in a tropical environment. Water, 8(12): 557. |
| [16] | Guo E L, Zhang J Q, Wang Y F, et al. 2019. Spatiotemporal variations of extreme climate events in Northeast China during 1960-2014. Ecol Indic, 96: 669-683. |
| [17] | Hameed F, Xu J Z, Rahim S F, et al. 2019. Optimizing nitrogen options for improving nitrogen use efficiency of rice under different water regimes. Agronomy, 9(1): 39. |
| [18] | Hamoud Y A, Guo X P, Wang Z C, et al. 2018. Effects of irrigation water regime, soil clay content and their combination on growth, yield, and water use efficiency of rice grown in South China. Int J Agric Biol Eng, 11(4): 144-155. |
| [19] | Hamoud Y A, Wang Z C, Guo X P, et al. 2019. Effect of irrigation regimes and soil texture on the potassium utilization efficiency of rice. Agronomy, 9(2): 100. |
| [20] | Hsiao T C, Heng L, Steduto P, et al. 2009. AquaCrop: The FAO crop model to simulate yield response to water: III. Parameterization and testing for maize. Agron J, 101(3): 448-459. |
| [21] | Huai H J, Chen X, Huang J, et al. 2020. Water-scarcity footprint associated with crop expansion in Northeast China: A case study based on AquaCrop modeling. Water, 12(1): 125. |
| [22] | Khalil A U R, Xu J Z, Hameed F, et al. 2022. Controlled drainage, to cope with the adverse impacts of climate change on paddy field’s hydrology: A simulation study using the drainmod model, Kunshan, China. Pak J Agric Sci, 59(2): 187-198. |
| [23] | Khokhar A, Shahbaz M, Maqsood M F, et al, 2023. Genetic modification strategies for enhancing plant resilience to abiotic stresses in the context of climate change. Funct Integr Genomics, 23(3): 283. |
| [24] | Lampayan R M, Rejesus R M, Singleton G R, et al. 2015. Adoption and economics of alternate wetting and drying water management for irrigated lowland rice. Field Crops Res, 170: 95-108. |
| [25] | Li Y. 2006. Water saving irrigation in China. J Exp Bot, 54(supp1): 40. |
| [26] | Li Z G, Yang P, Tang H J, et al. 2014. Response of maize phenology to climate warming in Northeast China between 1990 and 2012. Reg Environ Change, 14(1): 39-48. |
| [27] | Lin L, Zhang B, Xiong L. 2012. Evaluating yield response of paddy rice to irrigation and soil management with application of the AquaCrop model. Trans ASABE, 55(3): 839-848. |
| [28] | Linquist B A, Anders M M, Adviento-Borbe M A A, et al. 2015. Reducing greenhouse gas emissions, water use, and grain arsenic levels in rice systems. Glob Change Biol, 21(1): 407-417. |
| [29] | Liu Z J, Yang X G, Chen F, et al. 2013. The effects of past climate change on the northern limits of maize planting in Northeast China. Clim Change, 117(4): 891-902. |
| [30] | Malik A, Shakir A S, Ajmal M, et al. 2017. Assessment of AquaCrop model in simulating sugar beet canopy cover, biomass and root yield under different irrigation and field management practices in semi-arid regions of Pakistan. Water Resour Manag, 31(13): 4275-4292. |
| [31] | Maniruzzaman M, Talukder M S U, Khan M H, et al. 2015. Validation of the AquaCrop model for irrigated rice production under varied water regimes in Bangladesh. Agric Water Manag, 159: 331-340. |
| [32] | Mibulo T, Kiggundu N. 2018. Evaluation of FAO AquaCrop model for simulating rainfed maize growth and yields in Uganda. Agronomy, 8(11): 238. |
| [33] | Mueller N D, Gerber J S, Johnston M, et al. 2012. Closing yield gaps through nutrient and water management. Nature, 490: 254-257. |
| [34] | Paredes P, Torres M O. 2017. Parameterization of AquaCrop model for vining pea biomass and yield predictions and assessing impacts of irrigation strategies considering various sowing dates. Irrig Sci, 35(1): 27-41. |
| [35] | Piao S L, Ciais P, Huang Y, et al. 2010. The impacts of climate change on water resources and agriculture in China. Nature, 467: 43-51. |
| [36] | Raes D, Steduto P, Hsiao T C, et al. 2009. AquaCrop: The FAO crop model to simulate yield response to water: II. Main algorithms and software description. Agron J, 101(3): 438-447. |
| [37] | Raes D, Steduto P, Hsiao T C, et al. 2023. Calculation Procedure (Chapter 3): AquaCrop Reference Manuals. Rome, Italy: Food and Agriculture Organization of the United Nations. |
| [38] | Rahim S F, Xu J Z, Hameed F, et al. 2019. Spatiotemporal deviation in growing degree days and season under increasing temperature in Heilongjiang Province. Pak J Agric Sci, 56(4): 1075-1086. |
| [39] | Rahman M M, Chowdhury M M I, Al Amran M I U, et al, 2024. Impacts of climate change on food system security and sustainability in Bangladesh. J Water Clim Change, 15(5): 2162-2187. |
| [40] | Ran H, Kang S Z, Li F S, et al. 2018. Parameterization of the AquaCrop model for full and deficit irrigated maize for seed production in arid Northwest China. Agric Water Manag, 203: 438-450. |
| [41] | Rezaei E E, Webber H, Asseng S, et al, 2023. Climate change impacts on crop yields. Nat Rev Earth Environ, 4(12): 831-846. |
| [42] | Salemi H, Soom M A M, Lee T S, et al. 2011. Application of AquaCrop model in deficit irrigation management of winter wheat in arid region. Afr J Agric Res, 6(10): 2204-2215. |
| [43] | Schmidhuber J, Tubiello F N. 2007. Global food security under climate change. Proc Natl Acad Sci USA, 104(50): 19703-19708. |
| [44] | Seyed Raoufi R, Soufizadeh S, Amiri Larijani B, et al. 2018. Simulation of growth and yield of various irrigated rice (Oryza sativa L.) genotypes by AquaCrop under different seedling ages. Nat Resour Model, 31(2): e12162. |
| [45] | Shaaban A S A, Wahbi A, Sinclair T R. 2018. Sowing date and mulch to improve water use and yield of wheat and barley in the Middle East environment. Agric Syst, 165: 26-32. |
| [46] | Sheteiwy M S, Shao H B, Qi W C, et al. 2019. GABA-alleviated oxidative injury induced by salinity, osmotic stress and their combination by regulating cellular and molecular signals in rice. Int J Mol Sci, 20(22): 5709. |
| [47] | Shrestha L, Shrestha N K. 2017. Assessment of climate change impact on crop yield and irrigation water requirement of two major cereal crops (rice and wheat) in Bhaktapur district, Nepal. J Water Clim Change, 8(2): 320-335. |
| [48] | Shrestha N, Raes D, Sah S K. 2013. Strategies to improve cereal production in the Terai region (Nepal) during dry season: Simulations with aquacrop. In: Four Decades of Progress in Monitoring and Modeling of Processes in the Soil-Plant-Atmosphere System: Applications and Challenges. International Conference on Four Decades of Progress in Monitoring and Modeling of Processes in the Soil-Plant-Atmosphere System June 19-21, 2013, Naples, Italy: 767-775. |
| [49] | Shrestha S, Deb P, Bui T T T. 2016. Adaptation strategies for rice cultivation under climate change in Central Vietnam. Mitig Adapt Strateg Glob Change, 21(1): 15-37. |
| [50] | Steduto P, Hsiao T C, Raes D, et al. 2009. AquaCrop: The FAO crop model to simulate yield response to water: I. Concepts and underlying principles. Agron J, 101(3): 426-437. |
| [51] | Steduto P, Hsiao T C, Fereres E, et al. 2012. FAO Irrigation and Drainage Paper 66: Crop Yield Response to Water. Rome, Italy: Food and Agriculture Organization of the United Nations. |
| [52] | Tan J W, Cui Y L, Luo Y F. 2016. Global sensitivity analysis of outputs over rice-growth process in ORYZA model. Environ Model Softw, 83: 36-46. |
| [53] | Willmott C J. 1982. Some comments on the evaluation of model performance. Bull Amer Meteorol Soc, 63(11): 1309-1311. |
| [54] | Xia T, Wu W B, Zhou Q B, et al. 2014. Spatio-temporal changes in the rice planting area and their relationship to climate change in Northeast China: A model-based analysis. J Integr Agric, 13(7): 1575-1585. |
| [55] | Xu J Z, Lv Y P, Ai L K, et al. 2017. Validation of dual-crop coefficient method for calculation of rice evapotranspiration under drying-wetting cycle condition. Paddy Water Environ, 15(2): 381-393. |
| [56] | Xu J Z, Bai W H, Li Y W, et al. 2019. Modeling rice development and field water balance using AquaCrop model under drying-wetting cycle condition in Eastern China. Agric Water Manag, 213: 289-297. |
| [57] | Yin Y, Deng H, Wu S. 2019. Spatial-temporal variations in the thermal growing degree-days and season under climate warming in China during 1960-2011. Int J Biometeorol, 63(5): 649-658. |
| [58] | Zhai B Y, Fu Q, Li T X, et al. 2019. Rice irrigation schedule optimization based on the AquaCrop model: Study of the Longtouqiao irrigation district. Water, 11(9): 1799. |
| [59] | Zhang H, Tao F L, Xiao D P, et al. 2016. Contributions of climate, varieties, and agronomic management to rice yield change in the past three decades in China. Front Earth Sci, 10(2): 315-327. |
| [60] | Zhang X F, Wang D Y, Fang F P, et al. 2005. Food safety and rice production in China. Res Agric Modern, 26(2): 85-88. (in Chinese with English abstract) |
| [61] | Zheng J L, Chen T T, Chi D C, et al. 2019. Influence of zeolite and phosphorus applications on water use, P uptake and yield in rice under different irrigation managements. Agronomy, 9(9): 537. |
| [62] | Zhou C C, Huang Y C, Jia B Y, et al. 2018. Effects of cultivar, nitrogen rate, and planting density on rice-grain quality. Agronomy, 8(11): 246. |
| [1] | D. Priyanga, K. Amudha, N. Sakthivel, P. Sivasakthivelan, S. Utharasu, D. Uma, M. Sudha. Functional and Nutraceutical Potential of Indian Rice Landraces: A Comprehensive Scientific Review [J]. Rice Science, 2025, 32(6): 777-796. |
| [2] | Pattanapong Jaisue, Chalongrat Daengngam, Panuwat Pengphorm, Surapa Nutthapornnitchakul, Sompop Pinit, Lompong Klinnawee. Enhanced Chlorophyll Accumulation is Early Response of Rice to Phosphorus Deficiency [J]. Rice Science, 2025, 32(6): 831-844. |
| [3] | Hong Chen, Luo Ju, Feng Zelin, Ling Heping, Li Lingyi, Wu Jian, Yao Qing, Liu Shuhua. Intelligent Survey Method for Tiny Rice Pests and Their Natural Predators in Paddy Fields Using Augmented Reality (AR) Glasses [J]. Rice Science, 2025, 32(6): 868-884. |
| [4] | Daisy Wilson, Valeria Gonzalez, Hamidreza Sharifan. Evaluating Efficacy of ZnO and MgO Nanoparticles on Post-Harvested Rice to Enhance Food Security Against Agroterrorism [J]. Rice Science, 2025, 32(5): 717-726. |
| [5] | Ayaz Ahmad, Cheng Mingxing, Guo Yu, Luo Xiong, Yang Zihan, Liu Manman, Yuan Huanran, Li Qiancheng, Li Shaoqing, Fan Fengfeng. Identification and Characterization of WAKg Genes Involved in Rice Disease Resistance and Yield [J]. Rice Science, 2025, 32(5): 673-684. |
| [6] | Mareyam Mukhtar, Amresh Kumar, Ashfak S. Mujawar, Bhuvnesh Sareen, Suhas G. Karkute, Rohini Sreevathsa, Amitha Mithra Sevanthi, Amolkumar U. Solanke. Genome-Wide Identification of Dopamine β-Monooxygenase N-Terminal Gene Family in Rice and Its Role in Response to Blast Disease and Abiotic Stress [J]. Rice Science, 2025, 32(5): 685-703. |
| [7] | Li Haifeng, Fan Jiayi. Functions of Rice E3 Ubiquitin Ligases in Response to Environmental Stress and in Regulating Grain Size [J]. Rice Science, 2025, 32(5): 649-657. |
| [8] | Wu Zhaozhong, Zhong Zhengzheng, Xu Peng, Liu Ling, Wang Beifang, Yang Qinqin, Wen Xiaoxia, Ma Guifang, Luo Mili, Zhang Yingxin, Liu Qun’en, Peng Zequn, Zhan Xiaodeng, Cao Liyong, Cheng Shihua, Wu Weixun. OsELF3.1-OsCATA-Ghd7 Pathway Regulates Rice Heading [J]. Rice Science, 2025, 32(5): 658-672. |
| [9] | Pan Pan, Guo Wenlong, Li Hengbo, Shao Yifan, Guo Zhihao, Jin Ye, Cheng Yanrong, Yu Guoping, Fu Zhenshi, Hu Lin, Zheng Xiaoming, Zhou Guomin, Zhang Jianhua. Accelerating Wild Rice Disease-Resistant Germplasm Exploration: Artificial Intelligence (AI)-Powered Wild Rice Blast Disease Level Evaluation and Disease-Resistance Identification [J]. Rice Science, 2025, 32(5): 727-746. |
| [10] | Sabarinathan Selvaraj, Parameswaran Chidambaranathan, Goutam Kumar Dash, Priyadarsini Sanghamitra, Kishor Pundlik Jeughale, Cayalvizhi Balasubramaniasai, Devraj Lenka, Basavantraya Navadagi Devanna, Seenichamy Rathinam Prabhukarthikeyan, Sanghamitra Samantaray, Amaresh Kumar Nayak. Long-Range Admixture Linkage Disequilibrium and Allelic Responses of Sub1 and TPP7 under Consecutive Stress in Rice Validated Through Mendelian Randomization [J]. Rice Science, 2025, 32(5): 704-716. |
| [11] | Yong Jin Choi, Sun-Hwa Ha. Metabolic Engineering in Rice for Functional Metabolite Production [J]. Rice Science, 2025, 32(4): 475-498. |
| [12] | Dinuka Nuwan Tharaka, Nadeeka D. Tissera, Gayan Priyadarshana, Damayanthi Dahanayake. A Comprehensive Review of Hierarchical Porous Carbon Synthesis from Rice Husk [J]. Rice Science, 2025, 32(4): 499-511. |
| [13] | Li Xinyan, Weng Lüshui, Xiao Youlun, Li Jinjiang, Deng Lihua, Liu Qing, Kang Weiwei, Duan Yaping, Yang Daji, Xiao Guoying. Characteristic Analysis of Penta-Resistance Restorer Line for Hybrid Rice [J]. Rice Science, 2025, 32(4): 512-524. |
| [14] | Zhou Lin, Jiang Hong, Huang Long, Li Ziang, Yao Zhonghao, Li Linhan, Ji Kangwei, Li Yijie, Tang Haijuan, Cheng Jinping, Bao Yongmei, Huang Ji, Zhang Hongsheng, Chen Sunlu. Genome-Wide Association Study of Brown Rice Weight Identifies an RNA-Binding Protein Antagonistically Regulating Grain Weight and Panicle Number [J]. Rice Science, 2025, 32(4): 525-536. |
| [15] | Ratan Kumar Ganapati, Chen Kai, Zhao Xiuqin, Zheng Tianqing, Zhang Fan, Zhai Laiyuan, Xu Jianlong. Genome-Wide Association Study and Haplotype Analysis Jointly Identify New Candidate Genes for Alkaline Tolerance at Seedling Stage in Rice [J]. Rice Science, 2025, 32(4): 537-548. |
| Viewed | ||||||
|
Full text |
|
|||||
|
Abstract |
|
|||||