Rice Science ›› 2021, Vol. 28 ›› Issue (2): 178-190.DOI: 10.1016/j.rsci.2021.01.007
• Research Paper • Previous Articles Next Articles
Schmierer Marc1( ), Knopf Oliver2, Asch Folkard1
Received:2020-01-13
Accepted:2020-05-09
Online:2021-03-28
Published:2021-03-28
Schmierer Marc, Knopf Oliver, Asch Folkard. Growth and Photosynthesis Responses of a Super Dwarf Rice Genotype to Shade and Nitrogen Supply[J]. Rice Science, 2021, 28(2): 178-190.
Add to citation manager EndNote|Ris|BibTeX
| Treatment | No. of tillers per plant | Percentage of productive tillers (%) | No. of grains per panicle | Percentage of spikelet fertility (%) | Average single grain weight (mg) | Grain yield per plant (g) | ||
|---|---|---|---|---|---|---|---|---|
| N (mmol/L) | Light (L) | |||||||
| 2.8 | Full light | 24.0 ± 0.8 a | 66 ± 40 a | 13.2 ± 0.1 a | 91 ± 2 a | 21.0 ± 0.3 a | 4.002 ± 0.323 a | |
| 75% illumination | 10.3 ± 1.1 b | 64 ± 11 a | 11.3 ± 1.3 ab | 87 ± 0 a | 16.4 ± 0.4 a | 1.051 ± 0.155 b | ||
| 20% illumination | 6.7 ± 1.9 b | 3 ± 2 b | 1.3 ± 1.1 c | 8 ± 7 b | 4.8 ± 3.9 b | 0.005 ± 0.004 c | ||
| 1.4 | Full light | 30.0 ± 1.3 a | 54 ± 3 a | 14.2 ± 0.9 a | 87 ± 2 a | 20.3 ± 0.1 a | 3.980 ± 0.234 a | |
| 75% illumination | 10.3 ± 2.1 b | 56 ± 7 a | 12.6 ± 1.7 ab | 78 ± 4 a | 15.8 ± 0.6 a | 0.799 ± 0.073 bc | ||
| 20% illumination | 3.3 ± 1.2 b | 6 ± 5 b | 3.7 ± 3.0 bc | 0 ± 0 b | 0.0 ± 0.0 b | 0.000 ± 0.000 c | ||
| F value | FL | 81.28*** | 38.91*** | 19.03*** | 248.78*** | 45.71*** | 185.14*** | |
| FN | 0.37 | 0.95 | 0.79 | 4.40 | 1.60 | 0.27 | ||
| FLN | 3.45 | 0.53 | 0.08 | 0.17 | 0.70 | 0.20 | ||
| Relative decrease compared to control (Full N and full light) (%) | ||||||||
| 2.8 | 75% illumination | -57 | -3 | -13 | -4 | -22 | -74 | |
| 20% illumination | -72 | -95 | -90 | -91 | -77 | -100 | ||
| 1.4 | Full light | 25 | -18 | 7 | -5 | -4 | -1 | |
| 75% illumination | -57 | -15 | -5 | -14 | -25 | -80 | ||
| 20% illumination | -86 | -92 | -72 | -100 | -100 | -100 | ||
| Contribution to yield loss (%) | ||||||||
| 2.8 | 75% illumination | 58 | 3 | 13 | 4 | 22 | ||
| 20% illumination | 17 | 22 | 21 | 21 | 18 | |||
| 1.4 | Full light | -42 | 31 | -12 | 8 | 6 | ||
| 75% illumination | 49 | 13 | 4 | 12 | 21 | |||
| 20% illumination | 19 | 20 | 16 | 22 | 22 | |||
Table 1. Grain yield and its components of Super Dwarf Rice N71 grown under different treatments.
| Treatment | No. of tillers per plant | Percentage of productive tillers (%) | No. of grains per panicle | Percentage of spikelet fertility (%) | Average single grain weight (mg) | Grain yield per plant (g) | ||
|---|---|---|---|---|---|---|---|---|
| N (mmol/L) | Light (L) | |||||||
| 2.8 | Full light | 24.0 ± 0.8 a | 66 ± 40 a | 13.2 ± 0.1 a | 91 ± 2 a | 21.0 ± 0.3 a | 4.002 ± 0.323 a | |
| 75% illumination | 10.3 ± 1.1 b | 64 ± 11 a | 11.3 ± 1.3 ab | 87 ± 0 a | 16.4 ± 0.4 a | 1.051 ± 0.155 b | ||
| 20% illumination | 6.7 ± 1.9 b | 3 ± 2 b | 1.3 ± 1.1 c | 8 ± 7 b | 4.8 ± 3.9 b | 0.005 ± 0.004 c | ||
| 1.4 | Full light | 30.0 ± 1.3 a | 54 ± 3 a | 14.2 ± 0.9 a | 87 ± 2 a | 20.3 ± 0.1 a | 3.980 ± 0.234 a | |
| 75% illumination | 10.3 ± 2.1 b | 56 ± 7 a | 12.6 ± 1.7 ab | 78 ± 4 a | 15.8 ± 0.6 a | 0.799 ± 0.073 bc | ||
| 20% illumination | 3.3 ± 1.2 b | 6 ± 5 b | 3.7 ± 3.0 bc | 0 ± 0 b | 0.0 ± 0.0 b | 0.000 ± 0.000 c | ||
| F value | FL | 81.28*** | 38.91*** | 19.03*** | 248.78*** | 45.71*** | 185.14*** | |
| FN | 0.37 | 0.95 | 0.79 | 4.40 | 1.60 | 0.27 | ||
| FLN | 3.45 | 0.53 | 0.08 | 0.17 | 0.70 | 0.20 | ||
| Relative decrease compared to control (Full N and full light) (%) | ||||||||
| 2.8 | 75% illumination | -57 | -3 | -13 | -4 | -22 | -74 | |
| 20% illumination | -72 | -95 | -90 | -91 | -77 | -100 | ||
| 1.4 | Full light | 25 | -18 | 7 | -5 | -4 | -1 | |
| 75% illumination | -57 | -15 | -5 | -14 | -25 | -80 | ||
| 20% illumination | -86 | -92 | -72 | -100 | -100 | -100 | ||
| Contribution to yield loss (%) | ||||||||
| 2.8 | 75% illumination | 58 | 3 | 13 | 4 | 22 | ||
| 20% illumination | 17 | 22 | 21 | 21 | 18 | |||
| 1.4 | Full light | -42 | 31 | -12 | 8 | 6 | ||
| 75% illumination | 49 | 13 | 4 | 12 | 21 | |||
| 20% illumination | 19 | 20 | 16 | 22 | 22 | |||
| Developmental stage | Treatment | Leaf area (cm2) | SLA of whole plant (m2/kg) | Leaf area ratio (m2/kg) | Average leaf length (cm) | Average leaf width (cm) | Average leaf size (cm2) | |
|---|---|---|---|---|---|---|---|---|
| N (mmol/L) | Light (L) | |||||||
| Heading | 2.8 | Full light | 340 ± 30 a | 276 ± 7 b | 9.0 ± 0.2 b | 7.62 ± 0.71 b | 0.52 ± 0.01 a | 3.9 ± 0.3 a |
| 75% illumination | 219 ± 30 bc | 308 ± 6 ab | 11.3 ± 0.6 ab | 8.04 ± 0.32 b | 0.54 ± 0.04 a | 4.4 ± 0.5 a | ||
| 20% illumination | 138 ± 18 c | 361 ± 26 ab | 12.6 ± 0.4 a | 10.20 ± 0.16 a | 0.49 ± 0.01 a | 5.0 ± 0.2 a | ||
| 1.4 | Full light | 338 ± 5 ab | 267 ± 9 b | 8.6 ± 0.8 b | 7.72 ± 0.10 b | 0.53 ± 0.01 a | 4.1 ± 0.1 a | |
| 75% illumination | 218 ± 17 c | 295 ± 3 ab | 11.0 ± 0.5 ab | 8.42 ± 0.14 ab | 0.55 ± 0.02 a | 4.7 ± 0.3 a | ||
| 20% illumination | 132 ± 9 c | 330 ± 13 ab | 13.1 ± 0.3 a | 8.28 ± 0.19 ab | 0.50 ± 0.01 a | 4.2 ± 0.0 a | ||
| F value | FL | 33.48*** | 10.52** | 19.52*** | 7.32** | 1.91 | 1.88 | |
| FN | 0.03 | 1.78 | 0.01 | 1.99 | 0.33 | 0.26 | ||
| FLN | 0.01 | 0.26 | 0.31 | 4.53 | 0.01 | 1.75 | ||
| Flowering | 2.8 | Full light | 395 ± 29 a | 275 ± 6 b | 5.7 ± 0.1 bc | 7.60 ± 0.30 a | 0.59 ± 0.02 a | 4.5 ± 0.3 a |
| 75% illumination | 143 ± 28 bc | 259 ± 6 b | 5.0 ± 0.8 c | 9.08 ± 0.09 a | 0.59 ± 0.02 a | 5.3 ± 0.2 a | ||
| 20% illumination | 117 ± 31 c | 345 ± 4 a | 10.2 ± 0.3 a | 8.69 ± 0.49 a | 0.53 ± 0.03 a | 4.6 ± 0.5 a | ||
| 1.4 | Full light | 277 ± 13 ba | 260 ± 0 b | 5.2 ± 0.3 c | 7.56 ± 0.16 a | 0.61 ± 0.01 a | 4.6 ± 0.1 a | |
| 75% illumination | 140 ± 21 c | 311 ± 19 ab | 6.6 ± 0.3 bc | 8.69 ± 0.14 a | 0.56 ± 0.04 a | 4.9 ± 0.4 a | ||
| 20% illumination | 100 ± 24 c | 279 ± 14 b | 7.8 ± 0.4 ab | 8.54 ± 0.38 a | 0.53 ± 0.02 a | 4.5 ± 0.0 a | ||
| F value | FL | 37.76*** | 5.62* | 27.13*** | 7.15** | 2.37 | 1.42 | |
| FN | 3.99 | 1.04 | 1.14 | 0.43 | 0.00 | 0.26 | ||
| FLN | 2.45 | 10.99 | 7.47 | 0.11 | 0.21 | 0.25 | ||
| Ripening | 2.8 | Full light | 202 ± 6 a | 246 ± 16 a | 2.4 ± 0.2 ab | 6.77 ± 0.21 ab | 0.59 ± 0.00 a | 4.0 ± 0.1 a |
| 75% illumination | 53 ± 5 b | 199 ± 17 a | 1.8 ± 0.2 b | 6.36 ± 0.56 ab | 0.60 ± 0.03 a | 3.8 ± 0.2 a | ||
| 20% illumination | 73 ± 17 b | 358 ± 60 a | 5.7 ± 0.8 a | 8.83 ± 0.43 a | 0.58 ± 0.02 a | 5.1 ± 0.3 a | ||
| 1.4 | Full light | 215 ± 22 a | 235 ± 6 a | 2.3 ± 0.2 ab | 5.81 ± 0.07 ab | 0.56 ± 0.01 a | 3.3 ± 0.1 a | |
| 75% illumination | 64 ± 5 b | 243 ± 10 a | 2.2 ± 0.2 b | 5.31 ± 0.22 b | 0.50 ± 0.04 a | 2.7 ± 0.3 a | ||
| 20% illumination | 44 ± 15 b | 211 ± 57 a | 3.1 ± 1.1 ab | 7.10 ± 1.03 ab | 0.57 ± 0.04 a | 4.1 ± 0.9 a | ||
| F value | FL | 56.52*** | 0.36 | 6.45* | 6.09* | 0.35 | 3.89* | |
| FN | 0.01 | 0.29 | 1.74 | 5.66* | 3.04 | 4.89* | ||
| FLN | 1.04 | 1.39 | 2.49 | 0.22 | 1.13 | 0.06 | ||
| Developmental stage | Treatment | Flag leaf area (cm2) | SLA of flag leaf (m2/kg) | Chlorophyll a (µg/cm2) | Chlorophyll b (µg/cm2) | Chlorophyll a/b | ||
| N (mmol/L) | Light (L) | |||||||
| Heading | 2.8 | Full light | 8.8 ± 0.3 a | 110 ± 1 bc | 43.6 ± 1.8 a | 17.1 ± 2.6 a | 2.6 ± 0.2 a | |
| 75% illumination | 11.0 ± 1.5 a | 127 ± 4 ab | 42.5 ± 1.2 a | 18.8 ± 1.6 a | 2.3 ± 0.2 a | |||
| 20% illumination | 9.0 ± 1.2 a | 109 ± 3 c | 37.9 ± 2.5 a | 13.3 ± 1.1 a | 2.9 ± 0.1 a | |||
| 1.4 | Full light | 8.7 ± 0.4 a | 108 ± 2 c | 41.7 ± 1.4 a | 14.5 ± 1.7 a | 2.9 ± 0.2 a | ||
| 75% illumination | 9.7 ± 0.1 a | 130 ± 4 a | 39.2 ± 1.0 a | 15.8 ± 1.0 a | 2.5 ± 0.1 a | |||
| 20% illumination | 10.9 ± 0.6 a | 125 ± 2 abc | 33.2 ± 2.3 a | 11.3 ± 0.9 a | 2.9 ± 0.0 a | |||
| F value | FL | 1.31 | 14.77*** | 5.66* | 3.82 | 3.71 | ||
| FN | 0.04 | 3.34 | 3.32 | 2.73 | 1.51 | |||
| FLN | 1.30 | 3.52 | 0.21 | 0.04 | 0.16 | |||
| Flowering | 2.8 | Full light | 8.8 ± 0.6 a | 119 ± 2 a | 44.2 ± 1.1 ab | 17.7 ± 1.6 a | 2.5 ± 0.2 a | |
| 75% illumination | 10.6 ± 0.5 a | 128 ± 8 a | 34.9 ± 4.4 ab | 13.2 ± 2.6 a | 2.7 ± 0.2 a | |||
| 20% illumination | 9.7 ± 0.9 a | 134 ± 4 a | 27.1 ± 2.0 b | 8.3 ± 1.1 a | 3.4 ± 0.3 a | |||
| 1.4 | Full light | 8.4 ± 0.6 a | 108 ± 2 a | 45.1 ± 3.9 a | 18.5 ± 2.7 a | 2.5 ± 0.2 a | ||
| 75% illumination | 11.5 ± 1.1 a | 137 ± 9 a | 32.2 ± 3.4 ab | 10.1 ± 1.5 a | 3.2 ± 0.2 a | |||
| 20% illumination | 8.9 ± 0.9 a | 132 ± 4 a | 31.1 ± 2.4 ab | 10.6 ± 1.0 a | 2.9 ± 0.6 a | |||
| F value | FL | 3.46 | 5.30* | 8.96** | 7.62** | 4.11* | ||
| FN | 0.01 | 0.05 | 0.06 | 0.00 | 0.02 | |||
| FLN | 0.44 | 1.04 | 0.39 | 0.72 | 2.12 | |||
| Ripening | 2.8 | Full light | 9.9 ± 0.6 a | 116 ± 1 b | 43.5 ± 0.9 a | 16.2 ± 0.4 a | 2.7 ± 0.0 a | |
| 75% illumination | 8.1 ± 0.4 ab | 144 ± 4 a | 36.6 ± 0.3 c | 12.9 ± 0.6 a | 2.9 ± 0.2 a | |||
| 20% illumination | 10.2 ± 0.6 a | 134 ± 4 ab | 29.6 ± 0.9 d | 9.0 ± 0.5 b | 3.3 ± 0.1 a | |||
| 1.4 | Full light | 8.7 ± 0.6 ab | 118 ± 5 b | 41.2 ± 0.6 ab | 15.3 ± 0.4 a | 2.7 ± 0.0 a | ||
| 75% illumination | 9.2 ± 0.4 ab | 140 ± 7 ab | 37.6 ± 0.8 bc | 13.8 ± 0.7 a | 2.7 ± 0.1 a | |||
| 20% illumination | 6.9 ± 0.1 a | 121 ± 3 ab | 20.6 ± 0.9 e | 7.8 ± 1.1 b | 2.7 ± 0.3 a | |||
| F value | FL | 1.00 | 10.36** | 182.61*** | 43.53*** | 1.44 | ||
| FN | 5.79* | 1.35 | 21.07*** | 0.38 | 1.76 | |||
| FLN | 7.65** | 1.00 | 15.16*** | 1.00 | 1.02 | |||
Table 2. Leaf traits and chlorophyll content of Super Dwarf Rice N71 grown under different treatments.
| Developmental stage | Treatment | Leaf area (cm2) | SLA of whole plant (m2/kg) | Leaf area ratio (m2/kg) | Average leaf length (cm) | Average leaf width (cm) | Average leaf size (cm2) | |
|---|---|---|---|---|---|---|---|---|
| N (mmol/L) | Light (L) | |||||||
| Heading | 2.8 | Full light | 340 ± 30 a | 276 ± 7 b | 9.0 ± 0.2 b | 7.62 ± 0.71 b | 0.52 ± 0.01 a | 3.9 ± 0.3 a |
| 75% illumination | 219 ± 30 bc | 308 ± 6 ab | 11.3 ± 0.6 ab | 8.04 ± 0.32 b | 0.54 ± 0.04 a | 4.4 ± 0.5 a | ||
| 20% illumination | 138 ± 18 c | 361 ± 26 ab | 12.6 ± 0.4 a | 10.20 ± 0.16 a | 0.49 ± 0.01 a | 5.0 ± 0.2 a | ||
| 1.4 | Full light | 338 ± 5 ab | 267 ± 9 b | 8.6 ± 0.8 b | 7.72 ± 0.10 b | 0.53 ± 0.01 a | 4.1 ± 0.1 a | |
| 75% illumination | 218 ± 17 c | 295 ± 3 ab | 11.0 ± 0.5 ab | 8.42 ± 0.14 ab | 0.55 ± 0.02 a | 4.7 ± 0.3 a | ||
| 20% illumination | 132 ± 9 c | 330 ± 13 ab | 13.1 ± 0.3 a | 8.28 ± 0.19 ab | 0.50 ± 0.01 a | 4.2 ± 0.0 a | ||
| F value | FL | 33.48*** | 10.52** | 19.52*** | 7.32** | 1.91 | 1.88 | |
| FN | 0.03 | 1.78 | 0.01 | 1.99 | 0.33 | 0.26 | ||
| FLN | 0.01 | 0.26 | 0.31 | 4.53 | 0.01 | 1.75 | ||
| Flowering | 2.8 | Full light | 395 ± 29 a | 275 ± 6 b | 5.7 ± 0.1 bc | 7.60 ± 0.30 a | 0.59 ± 0.02 a | 4.5 ± 0.3 a |
| 75% illumination | 143 ± 28 bc | 259 ± 6 b | 5.0 ± 0.8 c | 9.08 ± 0.09 a | 0.59 ± 0.02 a | 5.3 ± 0.2 a | ||
| 20% illumination | 117 ± 31 c | 345 ± 4 a | 10.2 ± 0.3 a | 8.69 ± 0.49 a | 0.53 ± 0.03 a | 4.6 ± 0.5 a | ||
| 1.4 | Full light | 277 ± 13 ba | 260 ± 0 b | 5.2 ± 0.3 c | 7.56 ± 0.16 a | 0.61 ± 0.01 a | 4.6 ± 0.1 a | |
| 75% illumination | 140 ± 21 c | 311 ± 19 ab | 6.6 ± 0.3 bc | 8.69 ± 0.14 a | 0.56 ± 0.04 a | 4.9 ± 0.4 a | ||
| 20% illumination | 100 ± 24 c | 279 ± 14 b | 7.8 ± 0.4 ab | 8.54 ± 0.38 a | 0.53 ± 0.02 a | 4.5 ± 0.0 a | ||
| F value | FL | 37.76*** | 5.62* | 27.13*** | 7.15** | 2.37 | 1.42 | |
| FN | 3.99 | 1.04 | 1.14 | 0.43 | 0.00 | 0.26 | ||
| FLN | 2.45 | 10.99 | 7.47 | 0.11 | 0.21 | 0.25 | ||
| Ripening | 2.8 | Full light | 202 ± 6 a | 246 ± 16 a | 2.4 ± 0.2 ab | 6.77 ± 0.21 ab | 0.59 ± 0.00 a | 4.0 ± 0.1 a |
| 75% illumination | 53 ± 5 b | 199 ± 17 a | 1.8 ± 0.2 b | 6.36 ± 0.56 ab | 0.60 ± 0.03 a | 3.8 ± 0.2 a | ||
| 20% illumination | 73 ± 17 b | 358 ± 60 a | 5.7 ± 0.8 a | 8.83 ± 0.43 a | 0.58 ± 0.02 a | 5.1 ± 0.3 a | ||
| 1.4 | Full light | 215 ± 22 a | 235 ± 6 a | 2.3 ± 0.2 ab | 5.81 ± 0.07 ab | 0.56 ± 0.01 a | 3.3 ± 0.1 a | |
| 75% illumination | 64 ± 5 b | 243 ± 10 a | 2.2 ± 0.2 b | 5.31 ± 0.22 b | 0.50 ± 0.04 a | 2.7 ± 0.3 a | ||
| 20% illumination | 44 ± 15 b | 211 ± 57 a | 3.1 ± 1.1 ab | 7.10 ± 1.03 ab | 0.57 ± 0.04 a | 4.1 ± 0.9 a | ||
| F value | FL | 56.52*** | 0.36 | 6.45* | 6.09* | 0.35 | 3.89* | |
| FN | 0.01 | 0.29 | 1.74 | 5.66* | 3.04 | 4.89* | ||
| FLN | 1.04 | 1.39 | 2.49 | 0.22 | 1.13 | 0.06 | ||
| Developmental stage | Treatment | Flag leaf area (cm2) | SLA of flag leaf (m2/kg) | Chlorophyll a (µg/cm2) | Chlorophyll b (µg/cm2) | Chlorophyll a/b | ||
| N (mmol/L) | Light (L) | |||||||
| Heading | 2.8 | Full light | 8.8 ± 0.3 a | 110 ± 1 bc | 43.6 ± 1.8 a | 17.1 ± 2.6 a | 2.6 ± 0.2 a | |
| 75% illumination | 11.0 ± 1.5 a | 127 ± 4 ab | 42.5 ± 1.2 a | 18.8 ± 1.6 a | 2.3 ± 0.2 a | |||
| 20% illumination | 9.0 ± 1.2 a | 109 ± 3 c | 37.9 ± 2.5 a | 13.3 ± 1.1 a | 2.9 ± 0.1 a | |||
| 1.4 | Full light | 8.7 ± 0.4 a | 108 ± 2 c | 41.7 ± 1.4 a | 14.5 ± 1.7 a | 2.9 ± 0.2 a | ||
| 75% illumination | 9.7 ± 0.1 a | 130 ± 4 a | 39.2 ± 1.0 a | 15.8 ± 1.0 a | 2.5 ± 0.1 a | |||
| 20% illumination | 10.9 ± 0.6 a | 125 ± 2 abc | 33.2 ± 2.3 a | 11.3 ± 0.9 a | 2.9 ± 0.0 a | |||
| F value | FL | 1.31 | 14.77*** | 5.66* | 3.82 | 3.71 | ||
| FN | 0.04 | 3.34 | 3.32 | 2.73 | 1.51 | |||
| FLN | 1.30 | 3.52 | 0.21 | 0.04 | 0.16 | |||
| Flowering | 2.8 | Full light | 8.8 ± 0.6 a | 119 ± 2 a | 44.2 ± 1.1 ab | 17.7 ± 1.6 a | 2.5 ± 0.2 a | |
| 75% illumination | 10.6 ± 0.5 a | 128 ± 8 a | 34.9 ± 4.4 ab | 13.2 ± 2.6 a | 2.7 ± 0.2 a | |||
| 20% illumination | 9.7 ± 0.9 a | 134 ± 4 a | 27.1 ± 2.0 b | 8.3 ± 1.1 a | 3.4 ± 0.3 a | |||
| 1.4 | Full light | 8.4 ± 0.6 a | 108 ± 2 a | 45.1 ± 3.9 a | 18.5 ± 2.7 a | 2.5 ± 0.2 a | ||
| 75% illumination | 11.5 ± 1.1 a | 137 ± 9 a | 32.2 ± 3.4 ab | 10.1 ± 1.5 a | 3.2 ± 0.2 a | |||
| 20% illumination | 8.9 ± 0.9 a | 132 ± 4 a | 31.1 ± 2.4 ab | 10.6 ± 1.0 a | 2.9 ± 0.6 a | |||
| F value | FL | 3.46 | 5.30* | 8.96** | 7.62** | 4.11* | ||
| FN | 0.01 | 0.05 | 0.06 | 0.00 | 0.02 | |||
| FLN | 0.44 | 1.04 | 0.39 | 0.72 | 2.12 | |||
| Ripening | 2.8 | Full light | 9.9 ± 0.6 a | 116 ± 1 b | 43.5 ± 0.9 a | 16.2 ± 0.4 a | 2.7 ± 0.0 a | |
| 75% illumination | 8.1 ± 0.4 ab | 144 ± 4 a | 36.6 ± 0.3 c | 12.9 ± 0.6 a | 2.9 ± 0.2 a | |||
| 20% illumination | 10.2 ± 0.6 a | 134 ± 4 ab | 29.6 ± 0.9 d | 9.0 ± 0.5 b | 3.3 ± 0.1 a | |||
| 1.4 | Full light | 8.7 ± 0.6 ab | 118 ± 5 b | 41.2 ± 0.6 ab | 15.3 ± 0.4 a | 2.7 ± 0.0 a | ||
| 75% illumination | 9.2 ± 0.4 ab | 140 ± 7 ab | 37.6 ± 0.8 bc | 13.8 ± 0.7 a | 2.7 ± 0.1 a | |||
| 20% illumination | 6.9 ± 0.1 a | 121 ± 3 ab | 20.6 ± 0.9 e | 7.8 ± 1.1 b | 2.7 ± 0.3 a | |||
| F value | FL | 1.00 | 10.36** | 182.61*** | 43.53*** | 1.44 | ||
| FN | 5.79* | 1.35 | 21.07*** | 0.38 | 1.76 | |||
| FLN | 7.65** | 1.00 | 15.16*** | 1.00 | 1.02 | |||
| Developmental stage | Treatment | Fo/Fm | Pg(max) [µmol/(m2∙s)] | Icomp [µmol/(m2∙s)] | fI(0) [µmol/(m2∙s)] | Jmax [µmol/(m2∙s)] | Vc(max) [µmol/(m2∙s)] | |
|---|---|---|---|---|---|---|---|---|
| N ( mmol/L) | Light (L) | |||||||
| Heading | 2.8 | Full light | 0.82 ± 0.01 a | 19.1 ± 0.7 ab | 33.6 ± 2.6 a | 31.8 ± 1.2 a | 180 ± 21 a | 138 ± 16 a |
| 75% illumination | 0.82 ± 0.00 a | 19.8 ± 2.0 a | 24.1 ± 3.3 abc | 32.8 ± 3.2 a | 178 ± 18 a | 142 ± 11 a | ||
| 20% illumination | 0.82 ± 0.01 a | 14.0 ± 0.4 ab | 12.4 ± 3.3 bc | 30.5 ± 0.8 a | 135 ± 10 a | 111 ± 13 a | ||
| 1.4 | Full light | 0.83 ± 0.00 a | 15.2 ± 1.2 ab | 23.0 ± 1.7 abc | 26.3 ± 3.8 a | 152 ± 2 a | 131 ± 12 a | |
| 75% illumination | 0.83 ± 0.01 a | 18.1 ± 0.7 ab | 28.4 ± 4.4 ab | 29.2 ± 1.4 a | 156 ± 5 a | 131 ± 8 a | ||
| 20% illumination | 0.81 ± 0.00 a | 12.6 ± 1.0 b | 9.0 ± 2.2 c | 28.4 ± 3.6 a | 145 ± 5 a | 124 ± 5 a | ||
| F value | FL | 2.91 | 8.79** | 13.12*** | 0.20 | 2.04 | 1.11 | |
| FN | 0.07 | 4.31 | 1.11 | 1.97 | 1.07 | 0.02 | ||
| FLN | 1.05 | 0.49 | 1.96 | 0.13 | 0.88 | 0.45 | ||
| Flowering | 2.8 | Full light | 0.81 ± 0.00 a | 14.1 ± 0.7 a | 32.1 ± 1.2 a | 25.8 ± 1.5 ab | 141 ± 15 a | 124 ± 22 a |
| 75% illumination | 0.79 ± 0.00 a | 14.8 ± 0.5 a | 18.0 ± 3.7 a | 42.0 ± 5.3 a | 133 ± 8 a | 124 ± 10 a | ||
| 20% illumination | 0.81 ± 0.01 a | 13.0 ± 2.1 a | 30.6 ± 4.5 a | 29.3 ± 2.5 ab | 170 ± 32 a | 128 ± 12 a | ||
| 1.4 | Full light | 0.81 ± 0.01 a | 11.7 ± 1.5 a | 26.9 ± 4.5 a | 23.8 ± 3.6 b | 152 ± 4 a | 127 ± 5 a | |
| 75% illumination | 0.80 ± 0.00 a | 14.3 ± 1.2 a | 18.2 ± 3.5 a | 34.5 ± 1.4 ab | 168 ± 19 a | 161 ± 43 a | ||
| 20% illumination | 0.80 ± 0.01 a | 9.6 ± 1.6 a | 19.3 ± 2.9 a | 32.4 ± 0.7 ab | 126 ± 24 a | 110 ± 20 a | ||
| F value | FL | 1.6 | 1.8 | 3.4 | 7.0** | 0.0 | 0.4 | |
| FN | 0.0 | 2.3 | 2.3 | 0.6 | 0.0 | 0.1 | ||
| FLN | 1.5 | 0.4 | 0.9 | 1.1 | 1.4 | 0.5 | ||
| Ripening | 2.8 | Full light | 0.81 ± 0.01 a | 16.7 ± 1.8 a | 26.5 ± 4.1 a | 28.8 ± 0.6 a | 153 ± 5 a | 122 ± 6 a |
| 75% illumination | 0.81 ± 0.00 a | 16.6 ± 0.7 a | 28.0 ± 6.6 a | 36.4 ± 3.6 a | 170 ± 19 a | 107 ± 5 a | ||
| 20% illumination | 0.81 ± 0.00 a | 11.4 ± 1.2 ab | 10.1 ± 2.8 a | 34.0 ± 1.7 a | 121 ± 7 a | 136 ± 30 a | ||
| 1.4 | Full light | 0.79 ± 0.01 a | 11.6 ± 1.5 ab | 35.6 ± 6.9 a | 28.2 ± 3.2 a | 124 ± 16 a | 99 ± 14 a | |
| 75% illumination | 0.81 ± 0.01 a | 15.8 ± 1.4 a | 18.6 ± 2.8 a | 32.4 ± 1.3 a | 176 ± 14 a | 136 ± 8 a | ||
| 20% illumination | 0.80 ± 0.00 a | 7.2 ± 0.6 b | 20.4 ± 2.5 a | 31.5 ± 3.9 a | 114 ± 8 a | 109 ± 7 a | ||
| F value | FL | 2.6 | 10.3** | 3.9 | 1.8 | 6.6* | 0.3 | |
| FN | 3.8 | 6.8* | 0.5 | 0.8 | 0.6 | 0.3 | ||
| FLN | 1.5 | 1.1 | 1.9 | 0.1 | 0.6 | 1.5 | ||
Table 3. Photosynthetic parameters extracted from light response and A/Ci curves of Super Dwarf Rice N71 grown under different treatments.
| Developmental stage | Treatment | Fo/Fm | Pg(max) [µmol/(m2∙s)] | Icomp [µmol/(m2∙s)] | fI(0) [µmol/(m2∙s)] | Jmax [µmol/(m2∙s)] | Vc(max) [µmol/(m2∙s)] | |
|---|---|---|---|---|---|---|---|---|
| N ( mmol/L) | Light (L) | |||||||
| Heading | 2.8 | Full light | 0.82 ± 0.01 a | 19.1 ± 0.7 ab | 33.6 ± 2.6 a | 31.8 ± 1.2 a | 180 ± 21 a | 138 ± 16 a |
| 75% illumination | 0.82 ± 0.00 a | 19.8 ± 2.0 a | 24.1 ± 3.3 abc | 32.8 ± 3.2 a | 178 ± 18 a | 142 ± 11 a | ||
| 20% illumination | 0.82 ± 0.01 a | 14.0 ± 0.4 ab | 12.4 ± 3.3 bc | 30.5 ± 0.8 a | 135 ± 10 a | 111 ± 13 a | ||
| 1.4 | Full light | 0.83 ± 0.00 a | 15.2 ± 1.2 ab | 23.0 ± 1.7 abc | 26.3 ± 3.8 a | 152 ± 2 a | 131 ± 12 a | |
| 75% illumination | 0.83 ± 0.01 a | 18.1 ± 0.7 ab | 28.4 ± 4.4 ab | 29.2 ± 1.4 a | 156 ± 5 a | 131 ± 8 a | ||
| 20% illumination | 0.81 ± 0.00 a | 12.6 ± 1.0 b | 9.0 ± 2.2 c | 28.4 ± 3.6 a | 145 ± 5 a | 124 ± 5 a | ||
| F value | FL | 2.91 | 8.79** | 13.12*** | 0.20 | 2.04 | 1.11 | |
| FN | 0.07 | 4.31 | 1.11 | 1.97 | 1.07 | 0.02 | ||
| FLN | 1.05 | 0.49 | 1.96 | 0.13 | 0.88 | 0.45 | ||
| Flowering | 2.8 | Full light | 0.81 ± 0.00 a | 14.1 ± 0.7 a | 32.1 ± 1.2 a | 25.8 ± 1.5 ab | 141 ± 15 a | 124 ± 22 a |
| 75% illumination | 0.79 ± 0.00 a | 14.8 ± 0.5 a | 18.0 ± 3.7 a | 42.0 ± 5.3 a | 133 ± 8 a | 124 ± 10 a | ||
| 20% illumination | 0.81 ± 0.01 a | 13.0 ± 2.1 a | 30.6 ± 4.5 a | 29.3 ± 2.5 ab | 170 ± 32 a | 128 ± 12 a | ||
| 1.4 | Full light | 0.81 ± 0.01 a | 11.7 ± 1.5 a | 26.9 ± 4.5 a | 23.8 ± 3.6 b | 152 ± 4 a | 127 ± 5 a | |
| 75% illumination | 0.80 ± 0.00 a | 14.3 ± 1.2 a | 18.2 ± 3.5 a | 34.5 ± 1.4 ab | 168 ± 19 a | 161 ± 43 a | ||
| 20% illumination | 0.80 ± 0.01 a | 9.6 ± 1.6 a | 19.3 ± 2.9 a | 32.4 ± 0.7 ab | 126 ± 24 a | 110 ± 20 a | ||
| F value | FL | 1.6 | 1.8 | 3.4 | 7.0** | 0.0 | 0.4 | |
| FN | 0.0 | 2.3 | 2.3 | 0.6 | 0.0 | 0.1 | ||
| FLN | 1.5 | 0.4 | 0.9 | 1.1 | 1.4 | 0.5 | ||
| Ripening | 2.8 | Full light | 0.81 ± 0.01 a | 16.7 ± 1.8 a | 26.5 ± 4.1 a | 28.8 ± 0.6 a | 153 ± 5 a | 122 ± 6 a |
| 75% illumination | 0.81 ± 0.00 a | 16.6 ± 0.7 a | 28.0 ± 6.6 a | 36.4 ± 3.6 a | 170 ± 19 a | 107 ± 5 a | ||
| 20% illumination | 0.81 ± 0.00 a | 11.4 ± 1.2 ab | 10.1 ± 2.8 a | 34.0 ± 1.7 a | 121 ± 7 a | 136 ± 30 a | ||
| 1.4 | Full light | 0.79 ± 0.01 a | 11.6 ± 1.5 ab | 35.6 ± 6.9 a | 28.2 ± 3.2 a | 124 ± 16 a | 99 ± 14 a | |
| 75% illumination | 0.81 ± 0.01 a | 15.8 ± 1.4 a | 18.6 ± 2.8 a | 32.4 ± 1.3 a | 176 ± 14 a | 136 ± 8 a | ||
| 20% illumination | 0.80 ± 0.00 a | 7.2 ± 0.6 b | 20.4 ± 2.5 a | 31.5 ± 3.9 a | 114 ± 8 a | 109 ± 7 a | ||
| F value | FL | 2.6 | 10.3** | 3.9 | 1.8 | 6.6* | 0.3 | |
| FN | 3.8 | 6.8* | 0.5 | 0.8 | 0.6 | 0.3 | ||
| FLN | 1.5 | 1.1 | 1.9 | 0.1 | 0.6 | 1.5 | ||
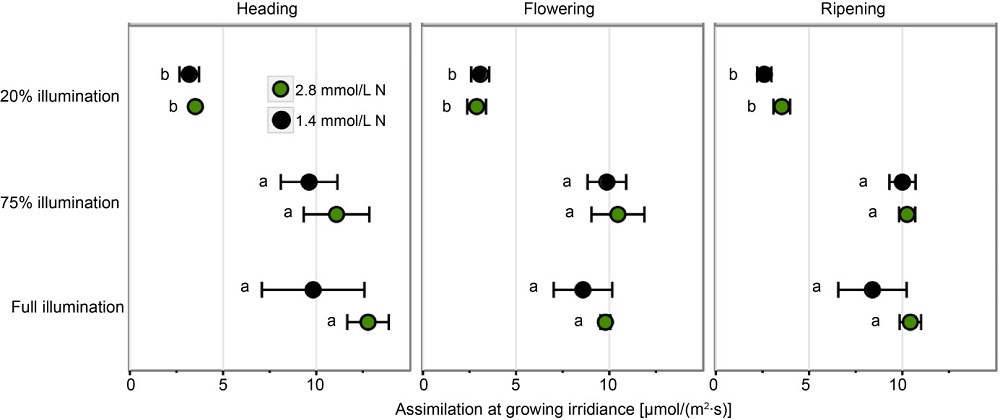
Fig. 1. Assimilation values of Super Dwarf Rice N71 at three different developmental stages under different treatments. Data are Mean ± SD (n = 3). Different letters in each plot indicate significant differences at P < 0.05 measured by the Tukey’s Honestly Significant Difference analysis.
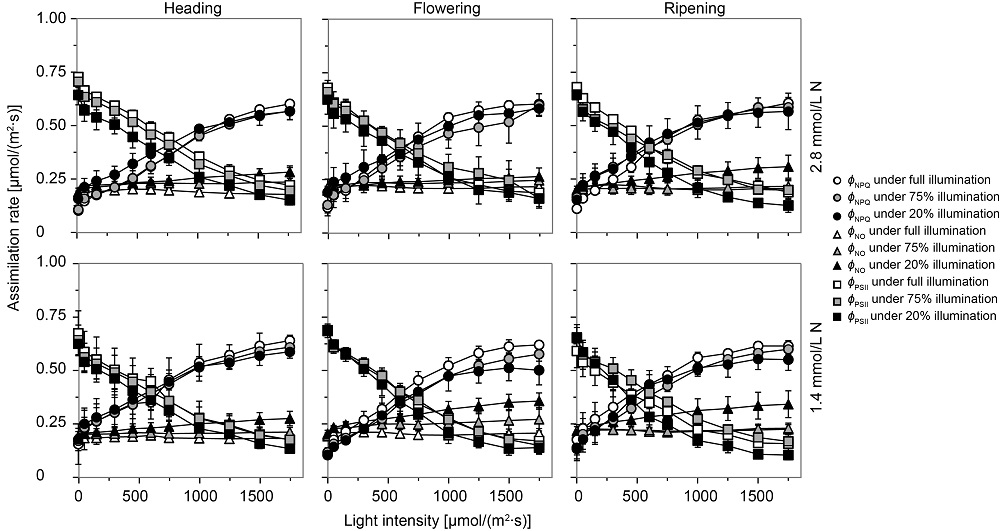
Fig. 2. Irradiance response curves of photochemical (ɸPSII), non-regulated (ɸNO) and non-photochemical (ɸNPQ) energy loss of Super Dwarf Rice N71 grown under three illumination levels and two nitrogen levels.Data are Mean ± SD (n = 3). Different lowercase letters in each plot indicate significant differences at P < 0.05 measured by the Tukey’s Honestly Significant Difference analysis.
| Developmental stage | Treatment | ɸPSII [µmol/(m2∙s)] | ɸNPQ [µmol/(m2∙s)] | ɸNO [µmol/(m2∙s)] | |
|---|---|---|---|---|---|
| N (mmol/L) | Light (L) | ||||
| Heading | 2.8 | Full light | 0.44 ± 0.00 ab | 0.36 ± 0.02 ab | 0.20 ± 0.01 a |
| 75% illumination | 0.46 ± 0.03 ab | 0.31 ± 0.02 ab | 0.23 ± 0.01 a | ||
| 20% illumination | 0.54 ± 0.03 a | 0.24 ± 0.05 b | 0.22 ± 0.01 a | ||
| 1.4 | Full light | 0.36 ± 0.04 b | 0.46 ± 0.04 a | 0.19 ± 0.00 a | |
| 75% illumination | 0.40 ± 0.02 ab | 0.39 ± 0.03 ab | 0.21 ± 0.01 a | ||
| 20% illumination | 0.51 ± 0.04 ab | 0.28 ± 0.04 b | 0.21 ± 0.00 a | ||
| F value | FL | 6.29* | 8.22** | 5.37* | |
| FN | 3.92 | 5.82 | 3.23 | ||
| FLN | 0.30 | 0.32 | 0.20 | ||
| Flowering | 2.8 | Full light | 0.30 ± 0.01 c | 14.10 ± 0.70 a | 0.21 ± 0.00 b |
| 75% illumination | 0.42 ± 0.03 bc | 0.49 ± 0.01 a | 0.23 ± 0.00 ab | ||
| 20% illumination | 0.53 ± 0.02 ab | 0.35 ± 0.03 bc | 0.21 ± 0.01 ab | ||
| 1.4 | Full light | 0.35 ± 0.01 c | 0.26 ± 0.02 cd | 0.20 ± 0.01 b | |
| 75% illumination | 0.40 ± 0.01 c | 0.45 ± 0.01 ab | 0.25 ± 0.01 a | ||
| 20% illumination | 0.58 ± 0.01 a | 0.35 ± 0.00 bc | 0.25 ± 0.00 a | ||
| F value | FL | 39.29*** | 47.35*** | 11.34** | |
| FN | 1.43 | 6.64 | 5.77* | ||
| FLN | 0.93 | 1.03 | 3.57 | ||
| Ripening | 2.8 | Full light | 0.35 ± 0.00 b | 0.45 ± 0.01 a | 0.20 ± 0.01 a |
| 75% illumination | 0.40 ± 0.02 b | 0.40 ± 0.03 a | 0.21 ± 0.01 a | ||
| 20% illumination | 0.52 ± 0.02 a | 0.26 ± 0.02 bc | 0.22 ± 0.01 a | ||
| 1.4 | Full light | 0.31 ± 0.02 b | 0.48 ± 0.02 a | 0.21 ± 0.01 a | |
| 75% illumination | 0.40 ± 0.03 b | 0.38 ± 0.03 ab | 0.22 ± 0.01 a | ||
| 20% illumination | 0.53 ± 0.00 a | 0.22 ± 0.01 c | 0.24 ± 0.01 a | ||
| F value | FL | 39.90*** | 34.11*** | 2.96 | |
| FN | 0.14 | 0.16 | 3.43 | ||
| FLN | 0.73 | 0.84 | 0.34 | ||
Table 4. Photochemical (ɸPSII), non-regulated (ɸNO) and non-photochemical (ɸNPQ) energy loss of Super Dwarf Rice N71 under different treatments.
| Developmental stage | Treatment | ɸPSII [µmol/(m2∙s)] | ɸNPQ [µmol/(m2∙s)] | ɸNO [µmol/(m2∙s)] | |
|---|---|---|---|---|---|
| N (mmol/L) | Light (L) | ||||
| Heading | 2.8 | Full light | 0.44 ± 0.00 ab | 0.36 ± 0.02 ab | 0.20 ± 0.01 a |
| 75% illumination | 0.46 ± 0.03 ab | 0.31 ± 0.02 ab | 0.23 ± 0.01 a | ||
| 20% illumination | 0.54 ± 0.03 a | 0.24 ± 0.05 b | 0.22 ± 0.01 a | ||
| 1.4 | Full light | 0.36 ± 0.04 b | 0.46 ± 0.04 a | 0.19 ± 0.00 a | |
| 75% illumination | 0.40 ± 0.02 ab | 0.39 ± 0.03 ab | 0.21 ± 0.01 a | ||
| 20% illumination | 0.51 ± 0.04 ab | 0.28 ± 0.04 b | 0.21 ± 0.00 a | ||
| F value | FL | 6.29* | 8.22** | 5.37* | |
| FN | 3.92 | 5.82 | 3.23 | ||
| FLN | 0.30 | 0.32 | 0.20 | ||
| Flowering | 2.8 | Full light | 0.30 ± 0.01 c | 14.10 ± 0.70 a | 0.21 ± 0.00 b |
| 75% illumination | 0.42 ± 0.03 bc | 0.49 ± 0.01 a | 0.23 ± 0.00 ab | ||
| 20% illumination | 0.53 ± 0.02 ab | 0.35 ± 0.03 bc | 0.21 ± 0.01 ab | ||
| 1.4 | Full light | 0.35 ± 0.01 c | 0.26 ± 0.02 cd | 0.20 ± 0.01 b | |
| 75% illumination | 0.40 ± 0.01 c | 0.45 ± 0.01 ab | 0.25 ± 0.01 a | ||
| 20% illumination | 0.58 ± 0.01 a | 0.35 ± 0.00 bc | 0.25 ± 0.00 a | ||
| F value | FL | 39.29*** | 47.35*** | 11.34** | |
| FN | 1.43 | 6.64 | 5.77* | ||
| FLN | 0.93 | 1.03 | 3.57 | ||
| Ripening | 2.8 | Full light | 0.35 ± 0.00 b | 0.45 ± 0.01 a | 0.20 ± 0.01 a |
| 75% illumination | 0.40 ± 0.02 b | 0.40 ± 0.03 a | 0.21 ± 0.01 a | ||
| 20% illumination | 0.52 ± 0.02 a | 0.26 ± 0.02 bc | 0.22 ± 0.01 a | ||
| 1.4 | Full light | 0.31 ± 0.02 b | 0.48 ± 0.02 a | 0.21 ± 0.01 a | |
| 75% illumination | 0.40 ± 0.03 b | 0.38 ± 0.03 ab | 0.22 ± 0.01 a | ||
| 20% illumination | 0.53 ± 0.00 a | 0.22 ± 0.01 c | 0.24 ± 0.01 a | ||
| F value | FL | 39.90*** | 34.11*** | 2.96 | |
| FN | 0.14 | 0.16 | 3.43 | ||
| FLN | 0.73 | 0.84 | 0.34 | ||
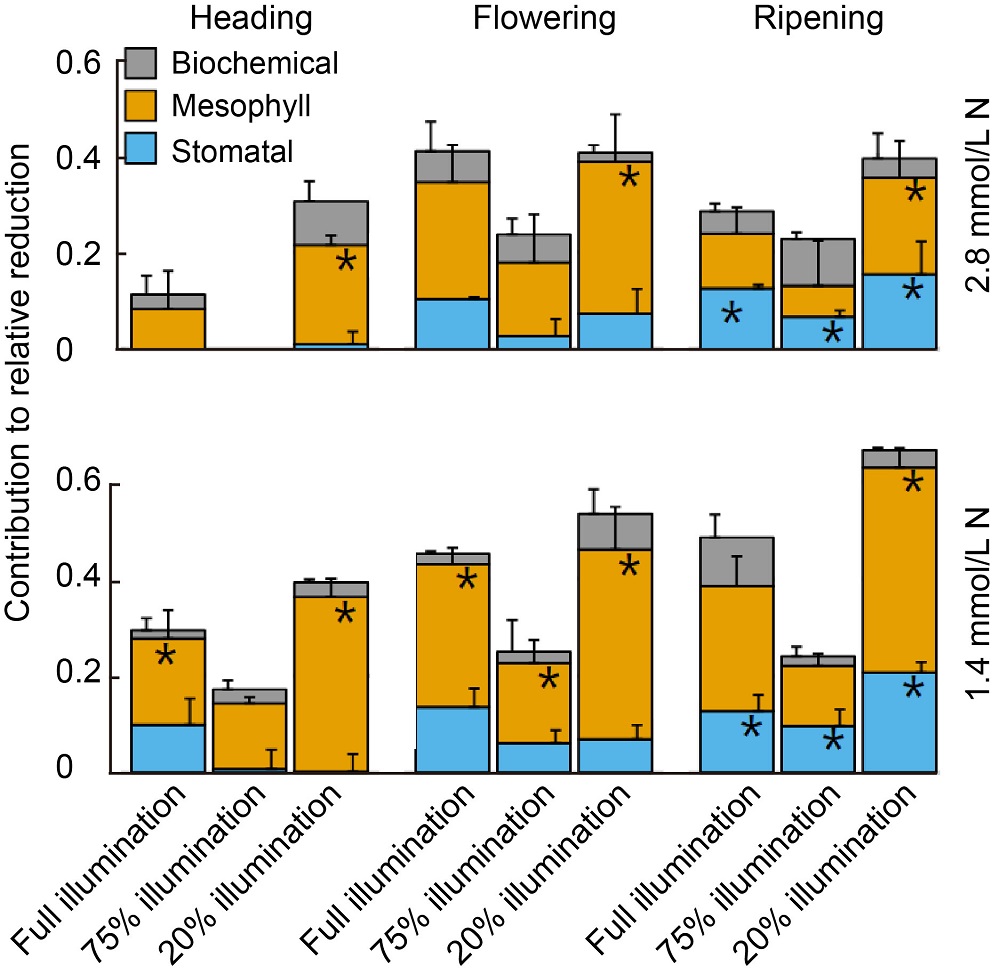
Fig. 3. Relative reduction of light saturated photosynthesis rates and contributions of different limiting components. Stars indicate significant differences (P < 0.05) from the reference value.
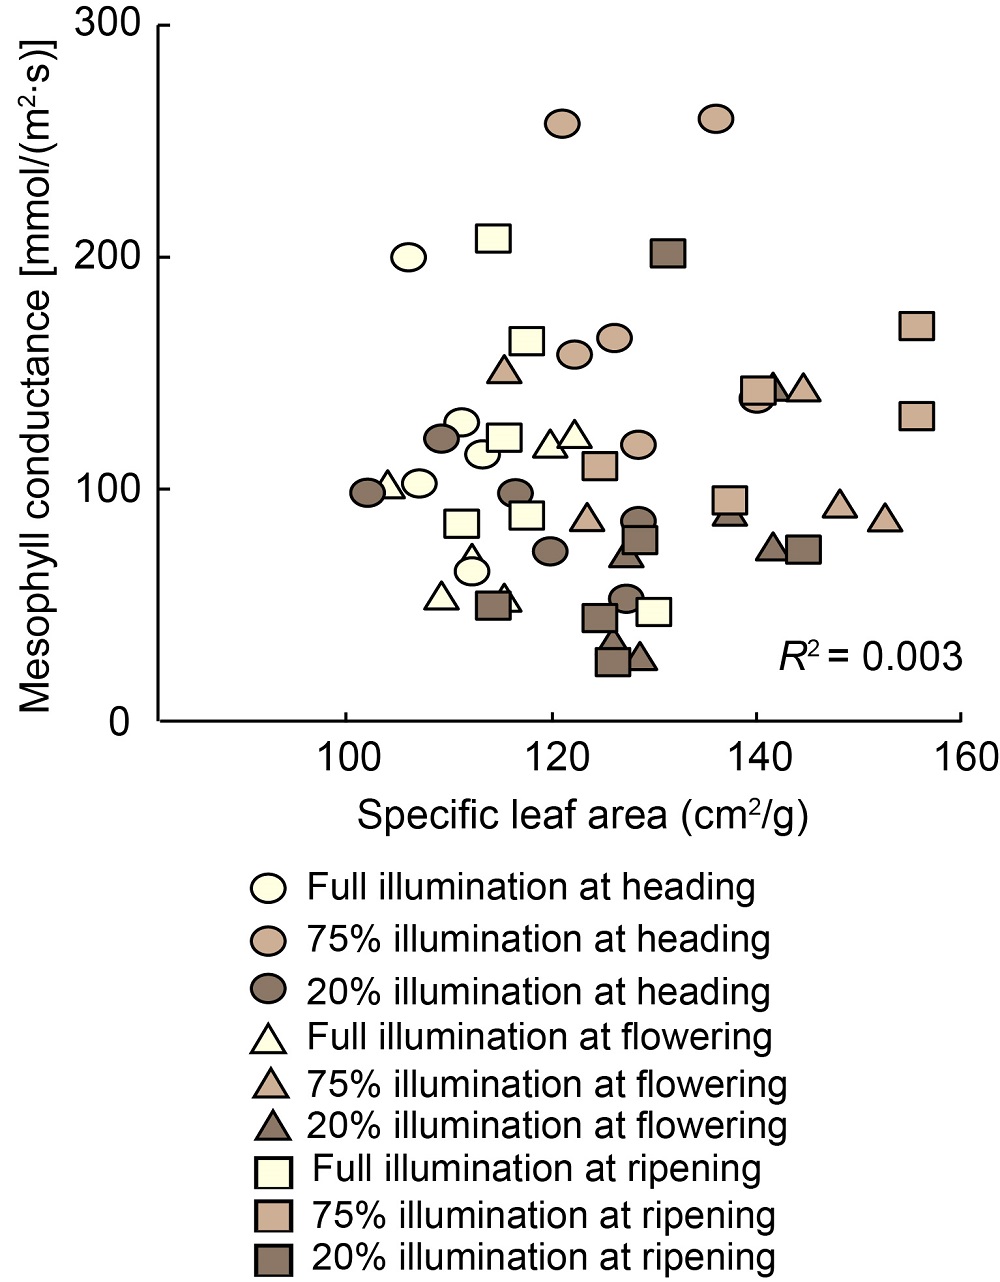
Fig. 4. Mesophyll conductance plotted vs. specific leaf area of Super Dwarf Rice N71 grown at different light intensities and nitrogen concentrations measured at three different developmental stages at growing irridiance.
| [1] | Bugbee B.1992. Determining the potential productivity of food crops in controlled environments.Adv Space Res, 12(5): 85-95. |
| [2] | Bugbee B.1999. Engineering plants for spaceflight environments.Gravit Space Biol Bull, 12(2): 67-74. |
| [3] | Caemmerer S V, Evans J R.1991. Determination of the average partial pressure of CO2 in chloroplasts from leaves of several C3 plants.Aust J Plant Physiol, 18(3): 287-305. |
| [4] | Cantagallo J E, Medan D, Hall A J.2004. Grain number in sunflower as affected by shading during floret growth, anthesis and grain setting.Field Crops Res, 85: 191-202. |
| [5] | Casal J J, Sanchez R A, Deregibus V A.1986. The effect of plant density on tillering: The involvement of R/FR ratio and the proportion of radiation intercepted per plant.Environ Exp Bot, 26(4): 365-371. |
| [6] | Cheng L L.2003. Xanthophyll cycle pool size and composition in relation to the nitrogen content of apple leaves.J Exp Bot, 54: 385-393. |
| [7] | Dai Y J, Shen Z G, Liu Y, Wang L L, Hannaway D, Lu H F.2009. Effects of shade treatments on the photosynthetic capacity, chlorophyll fluorescence, and chlorophyll content of Tetrastigma hemsleyanum Diels et Gilg.Environ Exp Bot, 65: 177-182. |
| [8] | de Souza I R P, MacAdam J W.2001. Gibberellic acid and dwarfism effects on the growth dynamics of B73 maize (Zea mays L.) leaf blades: A transient increase in apoplastic peroxidase activity precedes cessation of cell elongation.J Exp Bot, 52: 1673-1682. |
| [9] | Frantz J M, Bugbee B.2002. Anaerobic conditions improve germination of a gibberellic acid deficient rice.Crop Sci, 42(2): 651-654. |
| [10] | Frantz J M, Pinnock D, Klassen S, Bugbee B.2004. Characterizing the environmental response of a gibberellic acid-deficient rice for use as a model crop.Agron J, 96(4): 1172-1181. |
| [11] | Genty B, Briantais J M, Baker N R.1989. The relationship between the quantum yield of photosynthetic electron transport and quenching of chlorophyll fluorescence.Biochim Biophys Acta, 990(1): 87-92. |
| [12] | Germer J, Sauerborn J, Asch F, de Boer J, Schreiber J, Weber G, Müller J.2011. Skyfarming an ecological innovation to enhance global food security.J Verbr Lebensm, 6(2): 237-251. |
| [13] | Gommers C M M, Visser E J W, Onge K R S, Voesenek L A C J, Pierik R.2013. Shade tolerance: When growing tall is not an option.Trends Plant Sci, 18(2): 65-71. |
| [14] | Gong W Z, Jiang C D, Wu Y S, Chen H H, Liu W Y, Yang W Y.2015. Tolerance vs. avoidance: Two strategies of soybean (Glycine max) seedlings in response to shade in intercropping.Photosynthetica, 53(2): 259-268. |
| [15] | Grassi G, Magnani F.2005. Stomatal, mesophyll conductance and biochemical limitations to photosynthesis as affected by drought and leaf ontogeny in ash and oak trees.Plant Cell Environ, 28(7): 834-849. |
| [16] | Grassi G, Ripullone F, Borghetti M, Raddi S, Magnani F.2009. Contribution of diffusional and non-diffusional limitations to midday depression of photosynthesis in Arbutus unedo L.Trees, 23(6): 1149-1161. |
| [17] | Hanba Y T, Kogami H, Terashima I.2002. The effect of growth irradiance on leaf anatomy and photosynthesis in Acer species differing in light demand.Plant Cell Environ, 25(8): 1021-1030. |
| [18] | Hendrickson L, Furbank R T, Chow W S.2004. A simple alternative approach to assessing the fate of absorbed light energy using chlorophyll fluorescence.Photosynth Res, 82(1): 73-81. |
| [19] | Klughammer C, Schreiber U.2008. Complementary PSII quantum yields calculated from simple fluorescence parameters measured by PAM fluorometry and the saturation pulse method.PAM Appl Notes, 1: 27-35. |
| [20] | Kölling K, George G M, Künzli R, Flütsch P, Zeeman S C.2015. A whole-plant chamber system for parallel gas exchange measurements of Arabidopsis and other herbaceous species.Plant Methods, 11(1): 48. |
| [21] | Kuznetsova A, Brockhoff P B, Christensen R H B.2017. lmerTest package: Tests in linear mixed effects models.J Stat Softw, 82(13): 1-26. |
| [22] | Li H W, Jiang D, Wollenweber B, Dai T B, Cao W X.2010. Effects of shading on morphology, physiology and grain yield of winter wheat.Eur J Agron, 33(4): 267-275. |
| [23] | Li J R, Yu K, Wei J R, Ma Q, Wang B Q, Yu D.2010. Gibberellin retards chlorophyll degradation during senescence of paris polyphylla.Biol Plant, 54(2): 395-399. |
| [24] | Livingston N J, Davies G J, Eby B M, Filek G, Fuchs E E, Pepin S, Percy R E.1994. A whole-plant cuvette system to measure short-term responses of conifer seedlings to environmental change.Tree Physiol, 14: 759-768. |
| [25] | Mackill D J, Khush G S.2018. IR64: A high-quality and high- yielding mega variety.Rice, 11: 18. |
| [26] | Martins S C V, Galmés J, Cavatte P C, Pereira L F, Ventrella M C, DaMatta F M.2014. Understanding the low photosynthetic rates of sun and shade coffee leaves: Bridging the gap on the relative roles of hydraulic, diffusive and biochemical constraints to photosynthesis.PLoS One, 9(4): e95571. |
| [27] | Matsukura C, Itoh S I, Nemoto K, Tanimoto E, Yamaguchi J.1998. Promotion of leaf sheath growth by gibberellic acid in a dwarf mutant of rice.Planta, 205(2): 145-152. |
| [28] | Moualeu-Ngangue D P, Chen T W, Stützel H.2017. A new method to estimate photosynthetic parameters through net assimilation rate-intercellular space CO2 concentration (A-Ci) curve and chlorophyll fluorescence measurements.New Phytol, 213(3): 1543-1554. |
| [29] | Mu H, Jiang D, Wollenweber B, Dai T, Jing Q, Cao W.2010. Long- term low radiation decreases leaf photosynthesis, photochemical efficiency and grain yield in winter wheat.J Agron Crop Sci, 196(1): 38-47. |
| [30] | Piel C, Frak E, Le Roux X, Genty B.2002. Effect of local irradiance on CO2 transfer conductance of mesophyll in walnut.J Exp Bot, 53: 2423-2430. |
| [31] | Pinstrup-Andersen P.2018. Is it time to take vertical indoor farming seriously?Glob Food Sec, 17: 233-235. |
| [32] | Russo E.2003. Special report: The birth of biotechnology.Nature, 421: 456-457. |
| [33] | Sagardoy R, Vázquez S, Florez-Sarasa I D, Albacete A, Ribas- Carbó M, Flexas J, Abadía J, Morales F.2010. Stomatal and mesophyll conductances to CO2 are the main limitations to photosynthesis in sugar beet (Beta vulgaris) plants grown with excess zinc.New Phytol, 187(1): 145-158. |
| [34] | Samuolienė G, Sirtautas R, Brazaitytė A, Duchovskis P.2012. LED lighting and seasonality effects antioxidant properties of baby leaf lettuce.Food Chem, 134(3): 1494-1499. |
| [35] | Seabold S, Perktold J.2010. Statsmodels: Econometric and statistical modeling with python. In: van der Walt S, Millman J. Proceedings of the 9th Python in Science Conference: 57-61. |
| [36] | Searle S R, Speed F M, Milliken G A.1980. Population marginal means in the linear model: An alternative to least squares means.Am Stat, 34(4): 216-221. |
| [37] | Shrestha S, Brueck H, Asch F.2012. Chlorophyll index, photochemical reflectance index and chlorophyll fluorescence measurements of rice leaves supplied with different N levels.J Photochem Photobiol B, 113: 7-13. |
| [38] | Song X H, Li H.2016. Effects of building shade on photosynthesis and chlorophyll fluorescence of Euonymus fortunei.Acta Ecol Sin, 36(5): 350-355. |
| [39] | Sumanta N, Haque C I, Nishika J, Suprakash R.2014. Spectrophotometric analysis of chlorophylls and carotenoids from commonly grown fern species by using various extracting solvents.Res J Chem Sci Res, 4(9): 63-69. |
| [40] | Sun S, Moravek A, von der Heyden L, Held A, Sörgel M, Kesselmeier J.2016. Twin-cuvette measurement technique for investigation of dry deposition of O3 and PAN to plant leaves under controlled humidity conditions.Atmos Meas Tech Discuss, 9(2): 599-617. |
| [41] | Terashima I, Hanba Y T, Tazoe Y, Vyas P, Yano S.2006. Irradiance and phenotype: Comparative eco-development of sun and shade leaves in relation to photosynthetic CO2 diffusion.J Exp Bot, 57(2): 343-354. |
| [42] | Thomas S G, Sun T P.2004. Update on gibberellin signaling: A tale of the tall and the short.Plant Physiol, 135(2): 668-676. |
| [43] | Trapani N, Hall A J, Sadras V O, Vilella F.1992. Ontogenetic changes in radiation use efficiency of sunflower (Helianthus annuus L.) crops.Field Crops Res, 29(4): 301-316. |
| [44] | van Norman J M, Benfey P N.2009. Arabidopsis thaliana as a model organism in systems biology. Wires Syst Biol Med, 1(3): 372-379. |
| [45] | Verhoeven A S, Demmig-Adams B, Adams W W.1997. Enhanced employment of the xanthophyll cycle and thermal energy dissipation in spinach exposed to high light and N stress.Plant Physiol, 113(3): 817-824. |
| [46] | von Caemmerer S, Farquhar G D.1981. Some relationships between the biochemistry of photosynthesis and the gas exchange of leaves.Planta, 153(4): 376-387. |
| [47] | Wang L, Deng F, Ren W J.2015. Shading tolerance in rice is related to better light harvesting and use efficiency and grain filling rate during grain filling period.Field Crops Res, 180: 54-62. |
| [48] | Warren C R.2004. The photosynthetic limitation posed by internal conductance to CO2 movement is increased by nutrient supply.J Exp Bot, 55: 2313-2321. |
| [49] | Ye Z P.2007. A new model for relationship between irradiance and the rate of photosynthesis in Oryza sativa. Photosynthetica, 45(4): 637-640. |
| [50] | Yoshida S, Forno D A, Cock J.1971. Laboratory Manual for Physiological Studies of Rice. Los Baños, the Philippines: International Rice Research Institute. |
| [51] | Zabel P, Bamsey M, Schubert D, Tajmar M.2016. Review and analysis of over 40 years of space plant growth systems.Life Sci Space Res, 10: 1-16. |
| [52] | Zivcak M, Brestic M, Balatova Z, Drevenakova P, Olsovska K, Kalaji H M, Yang X H, Allakhverdiev S I.2013. Photosynthetic electron transport and specific photoprotective responses in wheat leaves under drought stress.Photosynth Res, 117: 529-546. |
| [1] | JI Dongling, XIAO Wenhui, SUN Zhiwei, LIU Lijun, GU Junfei, ZHANG Hao, Tom Matthew HARRISON, LIU Ke, WANG Zhiqin, WANG Weilu, YANG Jianchang. Translocation and Distribution of Carbon-Nitrogen in Relation to Rice Yield and Grain Quality as Affected by High Temperature at Early Panicle Initiation Stage [J]. Rice Science, 2023, 30(6): 12-. |
| [2] | Jiang Hongzhen, Wang Yamei, Lai Liuru, Liu Xintong, Miao Changjian, Liu Ruifang, Li Xiaoyun, Tan Jinfang, Gao Zhenyu, Chen Jingguang. OsAMT1.1 Expression by Nitrate-Inducible Promoter of OsNAR2.1 Increases Nitrogen Use Efficiency and Rice Yield [J]. Rice Science, 2023, 30(3): 222-234. |
| [3] | Qiu Diyang, Hu Rui, Li Ji, Li Ying, Ding Jierong, Xia Kuaifei, Zhong Xuhua, Fang Zhongming, Zhang Mingyong. Peptide Transporter OsNPF8.1 Contributes to Sustainable Growth under Salt and Drought Stresses, and Grain Yield under Nitrogen Deficiency in Rice [J]. Rice Science, 2023, 30(2): 113-126. |
| [4] | Yousef Alhaj Hamoud, Hiba Shaghaleh, Wang Ruke, Willy Franz Gouertoumbo, Amar Ali Adam hamad, Mohamed Salah Sheteiwy, Wang Zhenchang, Guo Xiangping. Wheat Straw Burial Improves Physiological Traits, Yield and Grain Quality of Rice by Regulating Antioxidant System and Nitrogen Assimilation Enzymes under Alternate Wetting and Drying Irrigation [J]. Rice Science, 2022, 29(5): 473-488. |
| [5] | Xu Chunchun, Chen Zhongdu, Ji Long, Lu Jianfei. Carbon and Nitrogen Footprints of Major Cereal Crop Production in China: A Study Based on Farm Management Surveys [J]. Rice Science, 2022, 29(3): 288-298. |
| [6] | Li Lin, Zhang Zheng, Tian Hua, Umair Ashraf, Yousef Alhaj Hamoud, Al Aasmi Alaa, Tang Xiangru, Duan Meiyang, Wang Zaiman, Pan Shenggang. Nitrogen Deep Placement Combined with Straw Mulch Cultivation Enhances Physiological Traits, Grain Yield and Nitrogen Use Efficiency in Mechanical Pot-Seedling Transplanting Rice [J]. Rice Science, 2022, 29(1): 89-100. |
| [7] | Sibo Chen, Liang Tang, Jian Sun, Quan Xu, Zhengjin Xu, Wenfu Chen. Contribution and Prospect of Erect Panicle Type to japonica Super Rice [J]. Rice Science, 2021, 28(5): 431-441. |
| [8] | Rakotoson Tatiana, Dusserre Julie, Letourmy Philippe, Frouin Julien, Ramonta Ratsimiala Isabelle, Victorine Rakotoarisoa Noronirina, Cao Tuong-Vi, Vom Brocke Kirsten, Ramanantsoanirina Alain, Ahmadi Nourollah, Raboin Louis-Marie. Genome-Wide Association Study of Nitrogen Use Efficiency and Agronomic Traits in Upland Rice [J]. Rice Science, 2021, 28(4): 379-390. |
| [9] | Asadi Hossein, Ghorbani Mohammad, Rezaei-Rashti Mehran, Abrishamkesh Sepideh, Amirahmadi Elnaz, Chengrong Chen, Gorji Manouchehr. Application of Rice Husk Biochar for Achieving Sustainable Agriculture and Environment [J]. Rice Science, 2021, 28(4): 325-343. |
| [10] | Panigrahy Madhusmita, Das Subhashree, Poli Yugandhar, Kumar Sahoo Pratap, Kumari Khushbu, C. S. Panigrahi Kishore. Carbon Nanoparticle Exerts Positive Growth Effects with Increase in Productivity by Down-Regulating Phytochrome B and Enhancing Internal Temperature in Rice [J]. Rice Science, 2021, 28(3): 289-300. |
| [11] | Kanta Gaihre Yam, Singh Upendra, D. Bible Wendie, Fugice Jr Job, Sanabria Joaquin. Mitigating N2O and NO Emissions from Direct-Seeded Rice with Nitrification Inhibitor and Urea Deep Placement [J]. Rice Science, 2020, 27(5): 434-444. |
| [12] | Chunmei Xu, Liping Chen, Song Chen, Guang Chu, Danying Wang, Xiufu Zhang. Rhizosphere Aeration Improves Nitrogen Transformation in Soil, and Nitrogen Absorption and Accumulation in Rice Plants [J]. Rice Science, 2020, 27(2): 162-174. |
| [13] | Yaobin Liu, Lin Qin, Fengbo Li, Xiyue Zhou, Chunchun Xu, Long Ji, Zhongdu Chen, Jinfei Feng, Fuping Fang. Impact of Rice-Catfish/Shrimp Co-culture on Nutrients Fluxes Across Sediment-Water Interface in Intensive Aquaculture Ponds [J]. Rice Science, 2019, 26(6): 416-424. |
| [14] | Danying Wang, Chang Ye, Chunmei Xu, Zaiman Wang, Song Chen, Guang Chu, Xiufu Zhang. Soil Nitrogen Distribution and Plant Nitrogen Utilization in Direct-Seeded Rice in Response to Deep Placement of Basal Fertilizer-Nitrogen [J]. Rice Science, 2019, 26(6): 404-415. |
| [15] | Moe Kyi, Moh Moh Seinn, Zaw Htwe Aung, Kajihara Yoshinori, Yamakawa Takeo. Effects of Integrated Organic and Inorganic Fertilizers on Yield and Growth Parameters of Rice Varieties [J]. Rice Science, 2019, 26(5): 309-318. |
| Viewed | ||||||
|
Full text |
|
|||||
|
Abstract |
|
|||||